Introducing Charts
Company charts
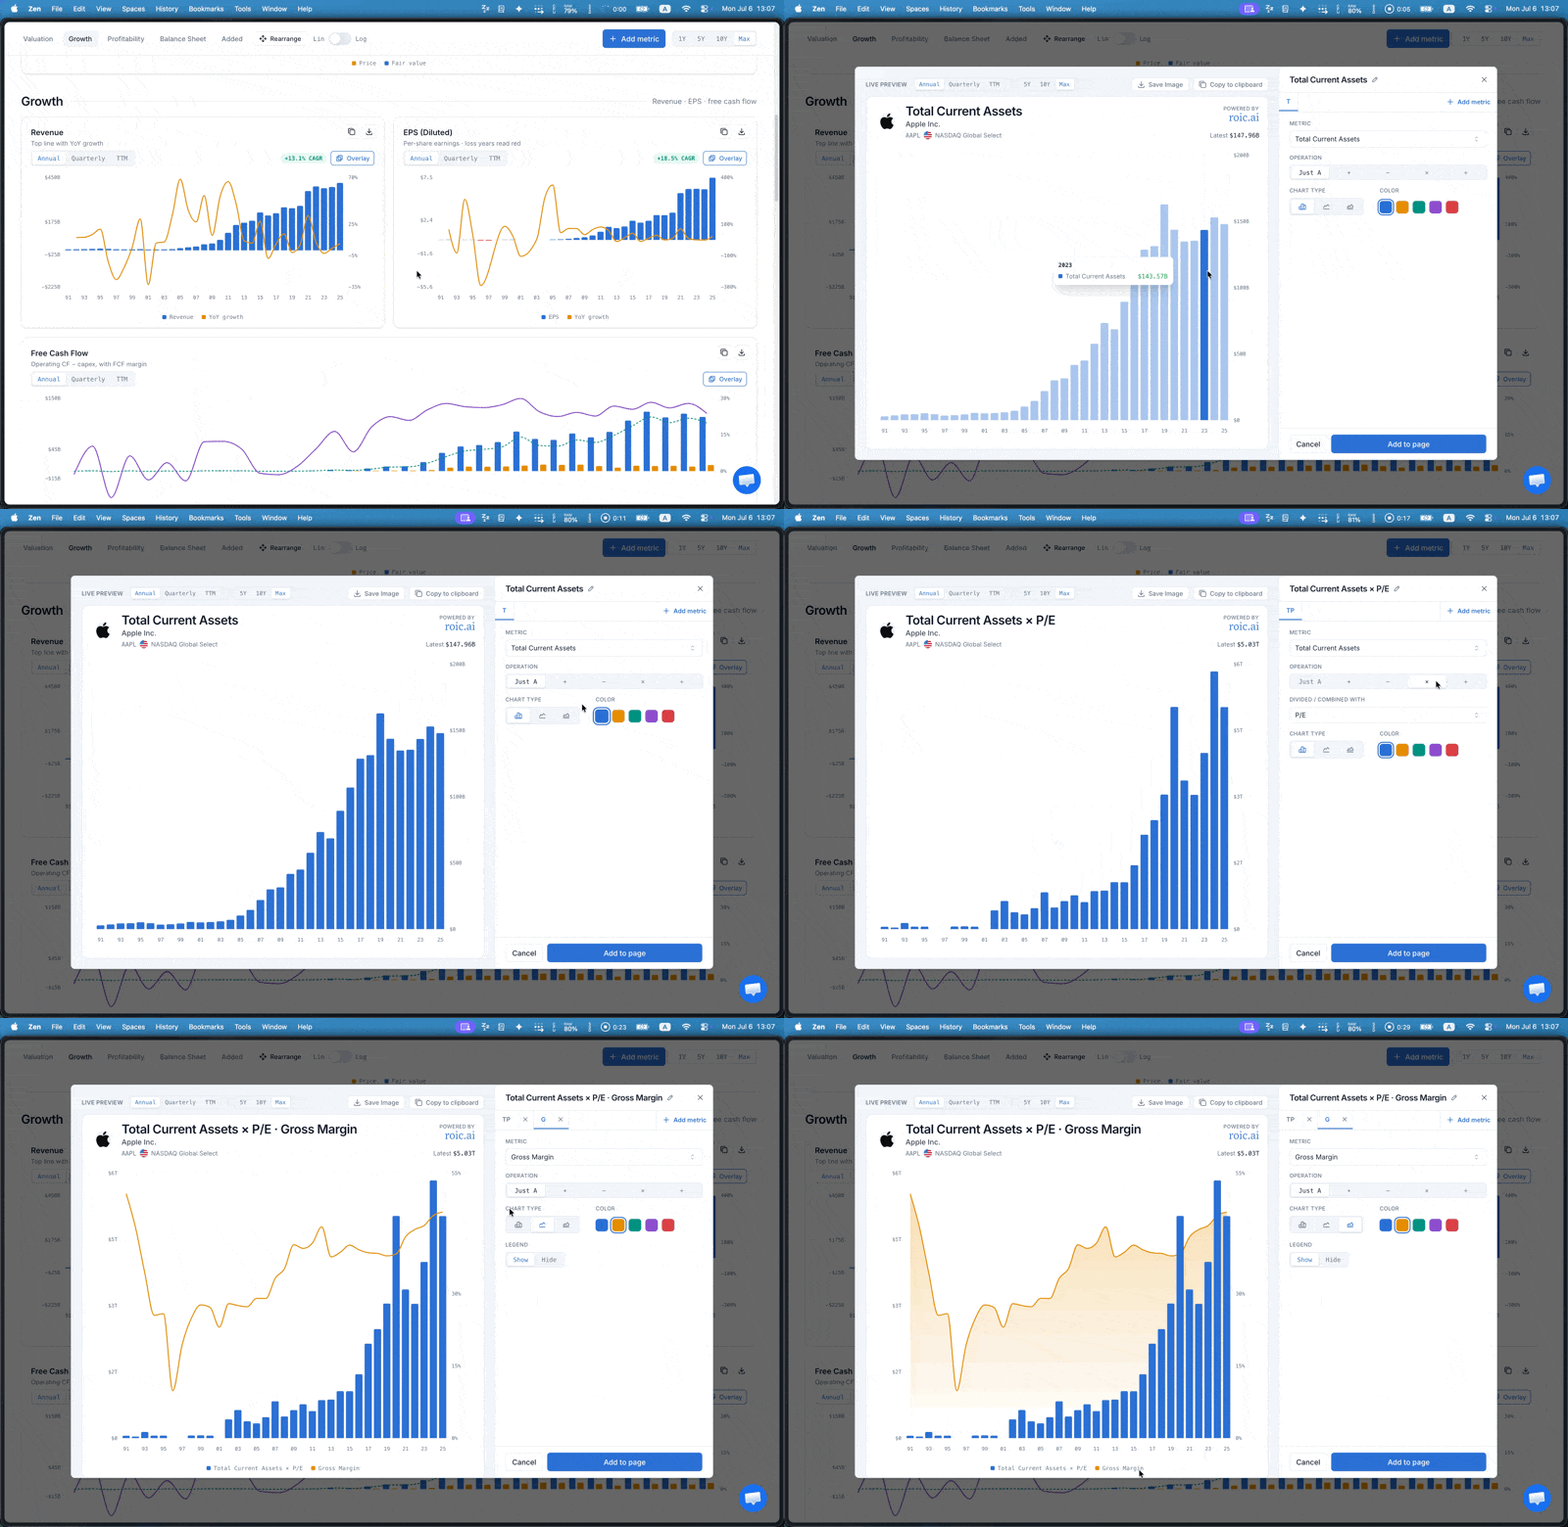
Introducing metric charts that turn raw financial data into a visual story. Instead of scanning tables, see revenue, margins, free cash flow, and ROIC trends at a glance, with a fair-value band that shows whether a stock is cheap right now. And much more!
Build your own metrics and overlays using metrics builder, and it becomes the workspace where you actually make the call.
You can check it out by clicking on the charts link in every company (quote) page.
🖐️ Share charts with your colleagues and friends; just copy or download chart images.
Improvements
ROIC.AI is now listed on several MCP directories, including glama and mcp.so, making it easier to integrate.
URLs are now selectable by clicking on them in API Explorer.
Refactored the gated user experience: hitting an auth-walled feature now dynamically routes users based on their status - sending existing users to /login and new users to /signup.
OG images are now 2x faster, thanks to takumi