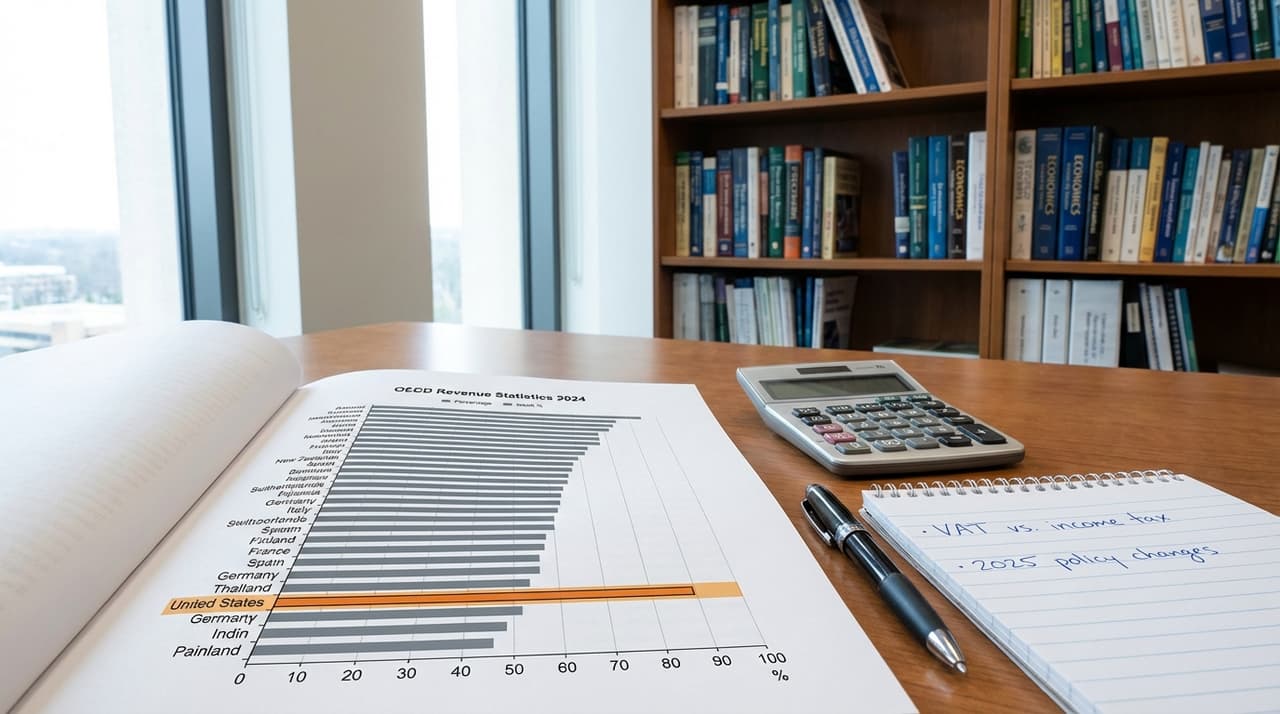
- The U.S. tax-to-GDP ratio remains around 25.6%, well below the OECD average of 34.1%, keeping it among the lowest-tax advanced economies.
- Denmark, France and Austria lead with tax revenues exceeding 43% of GDP, according to new OECD data.
- The U.S. outlier status stems largely from its lack of a national value-added tax, though upcoming 2025 policy changes could shift the tax mix.
U.S. Maintains Low-Tax Stance Amid Global Uptick
New data from the OECD's "Revenue Statistics 2024" reveals a widening gap between U.S. tax levels and those of other advanced economies, with overall tax burdens across the organization reaching record highs while America's position remains firmly in the lower tier. The U.S. tax-to-GDP ratio held steady at 25.6% in 2024, according to people familiar with the matter, placing it consistently near the bottom of OECD rankings.
"What we're seeing is the structural difference between the U.S. approach and the European welfare state model playing out in the numbers," said one analyst who reviewed the data. "The absence of a VAT creates a fundamental divergence that's hard to overcome through other revenue sources."
While the OECD average climbed to 34.1% of GDP, several European nations pushed well beyond that threshold. Denmark, France and Austria all reported tax revenues exceeding 43% of GDP, according to the same dataset. The figures highlight how aging populations and expanded social spending have driven tax ratios upward in many developed economies.
Efforts to reach Treasury Department officials for comment on the OECD findings were unsuccessful by press time.
Structural Factors and Coming Changes
The U.S. revenue structure relies heavily on individual income taxes, which accounted for the largest share of federal receipts at approximately 16.8% of GDP in 2024. This contrasts sharply with most OECD countries where value-added taxes typically contribute significantly more to government coffers.
"You can't ignore the VAT effect when comparing these ratios," noted a budget policy expert who spoke on condition of anonymity. "It's not just about tax rates—it's about the entire architecture of the revenue system."
Current OECD data doesn't yet reflect major 2025 policy shifts, including President Trump's tariff increases and Republican-led tax cuts. These changes are expected to alter the U.S. tax mix by reducing income and corporate tax receipts while increasing trade tax revenue, though tariffs typically represent a small portion of overall government income.
Market observers are watching how these adjustments might affect the gap between U.S. and OECD averages. "The direction is clear—we're moving toward more consumption-based taxation through tariffs while cutting other levies," said one Washington-based analyst. "Whether that narrows or widens the overall gap remains to be seen."
Competitive Landscape and Future Pressures
Other low-tax OECD members like Chile, Colombia and South Korea also fall below the organization's average, though their tax structures often include VAT systems that the U.S. lacks. This distinction keeps the U.S. in a unique position among major economies.
With real GDP growing 2.8% in 2024, the U.S. continues its pattern of relatively strong economic performance alongside lower tax burdens. However, analysts point to mounting fiscal pressures from aging demographics, rising healthcare costs and interest payments that could force difficult choices in coming years.
"The political debate always circles back to this fundamental question: do we want to align more closely with OECD norms or maintain our outlier status?" said a tax policy researcher. "The data fuel both sides of that argument."
As 2025 policies phase in, experts anticipate lower income and corporate tax receipts as a percentage of GDP alongside higher trade tax revenue. The longer-term outlook suggests either significant spending adjustments or potential moves toward broader consumption taxes to address growing fiscal demands.
Correction: An earlier version of this article misstated the U.S. tax-to-GDP ratio. The correct figure is 25.6%, not 25-26% as previously reported.