National Australia Bank Limited
Q4 FY2026 · Earnings Call TranscriptNovember 4, 2026
Sally Mihell
Thank you, operator. Good morning, and thank you for joining us today for NAB's full year 2026 results.
Before we start, I'd like to acknowledge the traditional owners of the land from which I join you today, the Gadigal people of the Eora nation. I'd like to pay respect to their elders past and present, and to the elders of the traditional lands from which you join us.
Presenting today will be Andrew Irvine, our Group CEO, and Inder Singh, our Group CFO and Group Executive Strategy. We're also joined in the room by members of NAB's executive team.
Following the presentations, there'll be an opportunity for analysts and investors to ask questions. I'll now hand to Andrew.
Andrew Irvine
Thank you, Sally, and good morning, everyone. NAB's full year 2026 results reflect strong growth in underlying profit, supported by good volume growth and higher margins.
These results have been delivered in an evolving environment, which has required customers to adapt to inflationary pressures, to higher cash rates, and to continued geopolitical uncertainty. We are supporting those customers who need our help.
We've continued to make progress on our three business priorities, namely to grow business banking, to drive deposit growth, and to strengthen proprietary home lending, and these priorities aim to improve returns over time, and pleasingly, each of our divisions has contributed to that progress. To achieve our ambition to be the most customer-centric company in Australia and New Zealand, we're continuing to modernize our technology to build a bank that's simple, that is fast, and that is resilient.
Looking ahead, the near-term outlook is more challenging. We have taken steps to simplify our operating model, including announcing we would reduce our internal workforce by up to 2,500 roles by September of 2027.
These are difficult decisions, and we are showing care, dignity, and respect to all of our colleagues who are impacted. At the same time, these actions will help make NAB a stronger bank, better placed to navigate both the risks and the opportunities that we see ahead.
Focusing first on our key numbers, both our underlying profit and cash earnings were impacted by the changes we made to our software capitalization policy in the first half. Excluding the impact of the large notable item, underlying profit increased 6.9% over the year.
This is a strong performance, led by good revenue growth. Cash earnings again excluding the notable item were flat, as the higher underlying profit was offset by higher credit impairment charges, which Inder will take you through shortly.
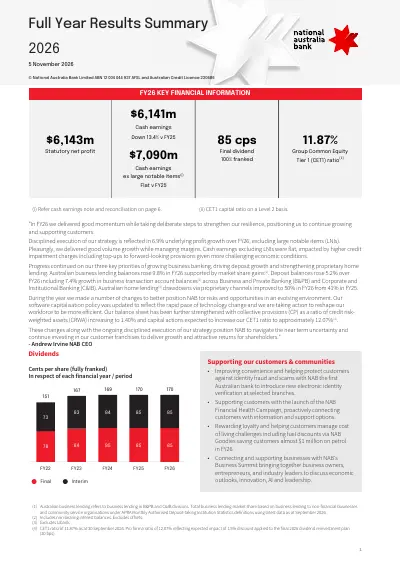
Our cash return on equity, including the impact of the notable item, was stable at 11.4%. We have declared a final dividend of 85 cents, which brings our total fiscal '26 dividend to $1.70, and this represents 73.7% of fiscal '26 cash earnings, excluding the notable item.
Turning to the economy and what we're doing to support our customers, persistent inflation, tighter monetary policy, and geopolitical uncertainty has seen a number of key economic indicators deteriorate over the past 12 months. We currently expect the RBA to keep rates on hold from here, but uncertainty remains high and cost pressures continue to pose a risk to economic growth in the near term.
Longer term, Australia has many advantages which position our country well. However, realizing our potential requires a sustained focus on productivity, to improve living standards, and to support sustainable economic growth.
While the economic environment has been challenging this year, our customers have remained resilient overall. Household buffers remain strong, and many of our business customers are seeing opportunities in the current environment to both grow and to invest.
Despite the resilience the vast majority of our customers are showing, it is not surprising that an increased number of customers do need our help, and this can be seen in the increase in both watch loans as well as early stage home loan arrears. Experience shows that the sooner we get on to problems, the better the resolution outcome tends to be for both our customers and for our bank.
Our relationships with business customers are particularly important in these times, as our bankers proactively reach out to customers to understand their circumstances. This year, we have improved our management disciplines relating to emerging customer stress.
This includes better early warning tools to make it easier for business bankers to identify and to support customers in need. Earlier engagement by bankers has also contributed to an increase in customers in lower risk bands being referred to our watch loan list, which is managed by specialist business bankers.
We're also investing to support our retail customers, including new community hubs in Werribee and Cairns that offer a wide range of in-branch support in conjunction with local community partners. Finally, we've expanded our NAB Goodies program, which has now delivered over $11.6 million of cashbacks and discounts to our customers.
Turning to our balance sheet, in order for us to grow and support our customers, particularly during these more challenging times, a resilient balance sheet is critical. In the first half of '26, we raised capital via a partially underwritten dividend reinvestment plan and increased our forward-looking provisions.
In light of today's economic outlook, we have again taken steps to further strengthen our balance sheet. The September Common Equity Tier 1 ratio of 11.87% is 22 basis points higher over the half, including the benefit of $1.8 billion of capital raised by the partial underwrite of the first half dividend reinvestment plan.
To further strengthen capital, a 1.5% discount will be applied to our full year dividend reinvestment plan. This is expected to increase our Group CET1 ratio by approximately 20 basis points to a pro forma of 12.07%.
At the first half of '26, we increased forward-looking collective provisions by $300 million, including increased overlays in sectors more likely to be impacted by fuel supply and fuel cost issues. In this result, we have added another $103 million to our forward-looking collective provisions, bringing the total collective provision balance to $5.4 billion.
This represents 1.4% of credit risk-weighted assets, with our total provision ratio increased to 1.76%. Liquidity and funding metrics remain well above regulatory minimums.
Now I'd like to take a moment to emphasize that our long-term strategy, centered on our ambition to be the most customer-centric company in Australia and New Zealand, remains unchanged. Now to achieve this ambition in an evolving operating environment, we need to be simpler and more efficient.
We recently announced actions to simplify our model and better align our workforce to strategic priorities. As part of these actions, we expect to reduce our internal workforce by 2,500 roles, or about 6% over fiscal '27, and we will also materially reduce the use of consultants and external contractors.
This will improve outcomes for customers by removing duplication and speeding up our decision-making. I am pleased to note that our focus on delivering better customer experiences, including through our NAB Customer Voices program, has helped increase the share of customers who see NAB as their main financial institution this year.
Our business MFI has increased by 210 basis points to 18.8%, while our consumer MFI has increased by 80 basis points to 11.7%. Our strategic NPS outcomes have also generally improved this year, however, rankings versus peers have been more mixed.
The standout for NAB has been medium and large business NPS, which has improved by 11 points over the last 12 months and is ranked first of all the banks. Continuing to improve the experience for all our customers remains an ongoing focus for everyone at NAB.
Our three key business priorities have been in place for some time now and are critical to our ability to drive stronger, sustainable returns. The first is continued growth in business banking, and across Corporate and Institutional Banking and Business and Private Banking, NAB is the largest business lender in Australia, with customers ranging from small traders to our largest corporates and institutions.
These are strong businesses getting stronger, despite competition, strategic disruption, and challenging economic environment. Together, they now account for 75% of the group's underlying profit, and we are determined to keep investing in and growing these businesses.
Our aim is to be the clear market leader in business and private banking and to pursue disciplined growth in corporate and institutional banking. The second is to drive deposit growth, with a clear focus on transactional accounts.
Finally, the third is to strengthen our proprietary home lending. This supports deeper customer relationships and helps manage margins and improve returns across our home lending portfolio.
Pleasingly, again, each of our divisions has contributed to our progress in these three strategic priorities. I'll now turn to each of our divisions, starting with Business and Private Banking, which supports around a million Australian businesses and plays an important role in supporting the Australian economy more broadly.
Competition in this segment has undoubtedly increased over recent years, but B&PB continues to compete from a position of strength, and we have navigated this economic environment well. Our relationship-led approach, increasingly enabled by digital data and analytics capabilities, continues to deliver good volume growth with broadly stable divisional margins and attractive shareholder returns.
Over fiscal '26, B&PB's business lending balances rose 10.5%, with growth across a diverse range of sectors. Deposit balances grew 6.1%, and our long-term focus on growing business transaction accounts has delivered a 22% increase in balances over the last two years.
Strong growth in JBWere net inflows reflects the strength of our high net worth offering in the private bank, and this is helping us meet both personal and business banking needs of our SME customers. The deep expertise and quality of our bankers is a key market differentiator for NAB, and a holistic approach to retaining these bankers, including continued investment in initiatives to enable bankers to spend more time with customers, has helped keep our turnover rates low.
Turning to Corporate and Institutional Banking, this division plays a key role as part of our broader business banking franchise. C&IB strategy is focused on deepening long-term relationships with target sector customers and leveraging strong capability and leading expertise in core products and services.
This is recognized in consistently high customer advocacy scores, including NAB ranking as the number one bank for Australian corporate and institutional relationships. C&IB achieved lending growth of 9% and deposit growth of 5.5% over the year.
Our investment in payment and liquidity management tools, together with our focus on deeper customer relationships, has supported a 23% increase in transactional deposit balances over the last two years. Together with ongoing simplification and disciplined balance sheet usage, this has driven strong returns.
Turning to Personal Banking, we are concentrating on deepening customer relationships in target segments through consistent and personalized experiences. A clear focus for us on mass affluent customers through our premier banking strategy has supported a 54% increase in new premier customers over the past two years, and we have launched a distinct digital experience for our premier customers, including more personalized interactions.
In Australian home lending, the proportion of flow through proprietary channels increased to 53% in the second half, and this is helping us manage what has become a more challenging market in recent months, and I'll cover that shortly. Personal Banking's deposit performance has been strong, with balances 7% higher over fiscal '26.
An ongoing investment in branches has helped deliver a 39% increase in branch-originated transaction account openings over the past two years. Turning more specifically to the housing market, which has clearly softened in recent months as both interest rate increases and budget changes have weighed on sentiment.
The resultant slowdown in credit growth has seen an increase in competition, placing pressure on system returns. This is an important product for NAB, but we will be disciplined in how we deploy our capital to support growth and optimize returns, and this includes making deliberate choices and taking a more segmented approach to where and how we will compete.
Our continued focus on strengthening proprietary distribution means we can adopt a more targeted approach to broker distribution. Brokers are an important distribution channel for NAB, and we are deepening relationships with our premium brokers through the launch of a more differentiated service proposition to a targeted cohort of high-value brokers to our bank.
In a more challenging second-half period, our home loan book grew below system, including the impact of the Advantedge runoff, which has been a material headwind. Consistent with our long-term strategy, our total proprietary book grew above system over this period, with the share of drawdowns via prop channels also increasing to over 50% in the second half, a major milestone for our bank.
Looking now at New Zealand Banking, the economy there continues to be challenging. Pleasingly, against this backdrop, New Zealand Banking achieved good momentum in its target segments of personal and business banking throughout the year.
This has been supported by a focus on perfecting the basics, building strong foundations, and delivering market-leading customer experiences. New Zealand Banking has delivered consistent growth in customers over time, and over fiscal '26, we grew above system in both household deposits and improved home lending market share at attractive returns.
Over the same period, we also gained share in business lending, where BNZ remains the largest lender in New Zealand. Turning now to how we are changing the bank, we are continuing to transform our bank to be simpler, faster, and more resilient, and this is embedded in how we run NAB.
Simplifying the bank means reducing the number of products we offer, eliminating duplication, and streamlining our processes. Over the past four years, we've cut the number of products by 32%, with an ambition to get up to 50%.
Being faster means leveraging digital data and AI to improve delivery speed to customers and to help our bankers be more productive. Over the past year, an 18% increase in the change delivery cycle has enabled us to deliver more features and benefits to customers from our investment slate.
Improved resilience is being achieved through continued modernization of our core technology platforms to reduce technology risk. We have strong technology foundations, including a modern cloud infrastructure and single data platform.
AI technology is developing rapidly, and will be increasingly important to how we serve customers and to how we run our bank. Over the last 12 months, NAB has set up our key AI squads and established clear frameworks and foundations to govern and manage AI activities, including a single AI platform.
More than 40,000 colleagues now have access to approved AI tools, and we've also established around 50 business-led squads of cross-divisional teams working alongside global strategic partners, such as Anthropic and AWS. We have prioritized use cases with clear alignment to our strategic priorities of business lending, prop home growth, and deposits, and our approach is based on agile product delivery, allowing us to test and learn quickly and safely.
This page highlights some of the early value outcomes for our group using agentic AI tools, and we are excited by the opportunity to deploy these technologies responsibly to improve customer and colleague experiences, drive productivity, and help colleagues spend more time serving our customers. I'll now pass to Inder, who will take you through the financial results in more detail.
Inder Singh
Thank you, Andrew, and good morning, all. I'll focus on our financial performance as measured on a half-on-half basis compared to the period ending March '26.
To give you the best view of underlying trends, I'll exclude the impact of the large notable item that we booked in the first half of 2026. Slide 21 provides an overview of our earnings performance.
Underlying profit was broadly stable. Revenue was higher despite lower markets and treasury income, mostly offset by seasonally higher costs.
Cash earnings declined 2.4%, with higher credit impairment charges, including a $103 million top-up to forward-looking provisions to reflect a more challenging outlook. Statutory profit rose 23.4%, primarily reflecting the non-repeat of the LNI in the first half.
Turning now to slide 22. While at a group level, underlying profit was fairly stable, we are particularly pleased with the earnings momentum in our business banking franchises.
Business and Private Banking was a standout, with 6.8% growth in underlying profit, reflecting strong business lending growth and higher margins. Corporate and Institutional Banking underlying profit ex-markets was up 3.9%, benefiting from improved margins.
Both Personal Banking and New Zealand Banking are performing well, given their more challenging market context. Personal Banking did well to hold underlying profit fairly stable, with flat margins and disciplined cost control.
New Zealand Banking held underlying profit broadly stable, with pleasing volume momentum. Turning now to slide 23.
Revenue rose 2.5%, and excluding markets and treasury, was up 3.6%. As Andrew mentioned, this was another period of strong lending performance, with growth aligned to our strategic priorities of business lending and proprietary home lending.
Underlying margins also improved, and I'll discuss these in more detail shortly. Fees and commissions rose $7 million, with lower customer remediation and higher wealth and lending fees, partly offset by seasonally lower capital markets fees.
The key drivers of lower markets and treasury income were lower trading outcomes in markets and softer customer revenue, including the non-repeat of some larger C&IB deals in the first half. The depreciation of the New Zealand dollar had a modest impact on revenue growth in the half.
Moving to slide 24. Net interest margin decreased 2 basis points over the half.
Excluding the impact of markets and treasury, which is largely revenue-neutral, underlying NIM increased 2 basis points this half, with higher earnings from our replicating portfolios, partly offset by lower lending margins and deposit mix. Lending margins contributed 2 basis points to NIM compression in the second half, with 1 basis point each from Australian home lending and Australian business lending, primarily reflecting ongoing competitive pressures.
Funding costs were fairly neutral this period, with stable spreads. The deposit book contributed 2 basis points to NIM compression over the half, with a couple of key drivers.
Firstly, mix contributed a drag of 2 basis points, mostly related to stronger growth in TD balances over the period. There was also a higher proportion of savings accounts earning bonus rates.
These trends are consistent with what we would expect in a higher interest rate environment. Secondly, deposit costs contributed a benefit of 1 basis point.
There were a number of small moving parts, but the main driver was the impact of cash rate increases on unhedged deposits. The 6 basis points replicating portfolio benefit to NIM is higher than our guidance of 5 basis points due to higher swap rates.
Most of the benefit this period relates to our five-year deposit hedge. Turning to some considerations for NIM in the first half of 2027.
Lending competition is expected to continue to impact margins. Replicating portfolio tailwinds are estimated at approximately 3 basis points, based on swap rates as at September 2026.
This remains the key area through which we are seeing the benefit from the rising rate environment. Our continued strong deposit growth this period has further reduced our sensitivity to changes in the bills/OIS spread.
A 9 basis point move in this spread is now equivalent to 1 basis point impact on NIM. Now moving to slide 25 on operating expenses.
Given timing and seasonality impacts between half years, my comments here will focus on full year drivers. Operating expenses rose 4.5% over the year, consistent with our guidance of less than 4.6%.
As you can see on the right-hand side of this chart, this expense growth included a headwind of $150 million from changes to our software capitalization policy, which was largely offset by benefits relating to the depreciation of the New Zealand dollar and lower remediation costs. Excluding these impacts, underlying cost growth was around 5%.
The impact of salary and inflation was 3.2%. The majority of this reflects pay rises from 1 January under the final year of our Australian enterprise agreement.
It also includes $47 million of inflation relating to third-party IT contracts. The combination of costs related to investment in our business was 5%, which includes volumes, technology and investment, and depreciation and amortization.
Volume-related costs rose $193 million, mostly reflecting a full-period impact of previous banker hires in Personal Banking, and to a lesser extent, in New Zealand Banking. Technology and investment spend rose $233 million.
This includes increased cloud consumption, data ingestion, and technology modernization. Total investment spend was $1.8 billion, which is fairly stable on the prior period.
Depreciation and amortization of $64 million reflects the timing of deployment of software assets. As flagged at the first half, the combined amortization impacts arising from the change in our software capitalization policy have been broadly offsetting in this period.
Other spend rose $139 million over the year. This includes a $40 million increase in short-term incentive payments and $40 million for higher fraud and financial crime costs.
Productivity savings were $463 million. Approximately 70% of these were personnel-related, arising from changes in the composition of our workforce and from insourcing.
There were also benefits realized through continued process improvement and simplification, operational and technology efficiencies. Moving now to the cost outlook for FY '27 on slide 26.
We expect underlying cost growth of less than 3% in FY '27 compared with reported costs in FY '26. In our view, this is an appropriate balance between investing in the business, funding growth, and driving productivity and efficiency.
It excludes the impact of two items that you can see on the right-hand side of the chart. Firstly, as previously announced, we are taking a restructuring charge of $300 million, which we expect to book in the first quarter of 2027.
Secondly, the change to our software capitalization policy will impact costs by $125 million, given a higher opex ratio. I'll briefly touch on some of the drivers of our underlying cost guidance.
Salary and inflation impacts are expected to be broadly in line with FY '26. Volume-related cost growth is expected to be lower than FY '26, which included the impact of bankers hired in prior periods.
This is consistent with an expected moderation in volume growth. Technology and investment is expected to remain a headwind, consistent with our ongoing focus on being a simpler, faster, and more resilient bank.
Investment spend is expected to be approximately $1.8 billion, with an opex ratio of around 55% to 60%. Depreciation, amortization will reflect the timing of assets deployed and is expected to remain a headwind in FY '27 before stabilizing into FY '28, as additions should more closely match the amortization profile.
We continue to focus on driving sustainable productivity savings to offset inflationary pressures and create capacity for investment. This remains an important focus for us to achieve our targeted cost growth in FY '27 and will include the impact of announced changes to our workforce.
Remediation remains ongoing and is difficult to forecast, noting that $80 million of charges were booked in FY '26 for customer and payroll remediation matters. Now turning to asset quality trends on slide 27.
As Andrew noted, the economic environment became more challenging over the second half. We are starting to see some signs of stress, including liquidity pressures impacting asset values.
This tougher operating environment and outlook has contributed to an uplift in credit impairment charges this half to $841 million, or 20 basis points of GLAs. The charges include a $103 million top-up to forward-looking collective provisions.
This is in addition to the $300 million we added in the first half. The underlying collective charge in the period was $196 million in the second half.
This included three key components, net of transfers to IAPs. Firstly, continued strong business lending growth in B&PB had a sizable impact.
Secondly, we saw modest deterioration in customer credit ratings. Finally, lower house prices have driven higher loss given default assumptions.
The migration in customer credit ratings mainly reflects cash flow challenges, and these have contributed to the deterioration in watch and non-performing loan ratios, compared with the improvement we saw in the first half. At this stage, transition rates from watch into non-performing remain fairly stable.
IAP charges were broadly consistent over the half and remain elevated at $542 million. The business lending portfolio was the primary contributor, reflecting tighter secondary market liquidity and refinancing options.
The charge also included some additional impairment for a small number of larger offshore customers in C&IB's utilities portfolio. Unsecured personal lending charges remained broadly stable.
It is also worth referencing mortgage arrears, which are higher this period. The ratio of 90-days-past-due increased 9 basis points over the second half for the Australian home lending portfolio.
The key driver here has been cash flow pressures, with the deterioration materially skewed to mortgages serviced by business income. I'll now turn to provisioning on slide 28.
Total provisions increased $415 million over the half and now represent 1.6 times our base case scenario and equate to 1.76% of credit risk-weighted assets. Collective provisions rose $278 million to 1.4% of credit risk-weighted assets.
This includes an increase in forward-looking collective provisions of $103 million, primarily reflecting changes in our base case economic assumptions given the more challenging economic outlook. Total target sector forward-looking adjustments remained largely unchanged over the half.
We added a new $75 million sector overlay for the utilities exposures I referenced earlier. These relate to broadband customers in Europe and the UK, where the sector continues to face a number of challenges.
This has been offset by partial releases across all other sectors as more stress is now captured in our base case assumptions. Given the economic outlook, asset quality may deteriorate further in coming periods, but we are well provided for this.
Moving now to capital on slide 29. Our Group CET1 ratio increased 22 basis points to 11.87% at year end.
Key moving parts are shown on the chart on screen. Cash earnings added 78 basis points, partly offset by 58 basis points for payment of the 2026 interim dividend.
Credit risk-weighted asset movements reduced the CET1 ratio by 21 basis points, mainly reflecting strong business lending growth, partially offset by the removal of certain model overlays related to off-balance-sheet exposures. The other RWA bucket reduced CET1 by 7 basis points, primarily reflecting an 11 basis point reduction from higher swap rates impacting IRRBB risk-weighted assets.
This was partially offset by lower market risk. Net FX translation was a drag of 3 basis points relating to the depreciation of the New Zealand dollar.
Finally, the benefit of capital actions related to our interim dividend contributed 40 basis points. The final 2026 DRP will include a 1.5% discount expected to raise approximately $900 million, or 20 basis points of CET1 capital, taking our pro forma ratio to 12.07%.
I will now turn to slide 30 to provide some further context around how we are thinking about our capital settings in FY '27. Over the past year, our CET1 ratio increased from a pro forma 11.81% as at September 2025 to a pro forma 12.07% at September 2026, an increase of 26 basis points.
The key drivers of this increase are set out on this slide. Lending growth consumed 55 basis points of capital, including 42 basis points from non-retail credit growth.
This is consistent with our strategy and is expected to support earnings growth over coming periods. Capital was also impacted by elevated volatility, both in higher rates and in foreign exchange markets, as well as by the deteriorating economic outlook, where we have responded by increasing our forward-looking credit provisions by $403 million.
New capital issuance totaled 60 basis points, including the expected impact of the FY '26 discounted DRP. Going forward, we are starting FY '27 with a much stronger capital position, which we believe is appropriate in the current environment.
We are also taking actions to improve organic capital generation. These include, firstly, more deliberate portfolio positioning to allocate capital to higher-returning segments; secondly, targeting lower growth in our underlying costs to deliver sustainable improvements in efficiency; and lastly, driving a much stronger link between our investment spend and value creation for customers and shareholders.
The expected moderation of business credit growth in FY '27 will also support improved capital generation. As I have flagged earlier, asset quality may deteriorate further, and our capital plans include credit migration assumptions aligned to our base case economic scenario.
Overall, we are confident that a stronger starting position and a focus on improved capital generation will support continued growth and sustainable shareholder returns. Liquidity and funding are set out on slide 31.
The quarterly LCR ratio is 3 basis points higher over the half at 135%, and NSFR was stable at 116%. Both ratios are well above the minimum requirement.
We continue to manage funding and liquidity prudently, and our balance sheet is well positioned for periods of market volatility. We issued $38 billion of term funding during the year, supporting repayment of maturities in the period.
Over the course of financial year 2027, issuance is expected to be broadly in line with prior years. I'll now hand back to Andrew.
Andrew Irvine
Thank you, Inder. As Inder and I have outlined today, we have taken actions which make NAB a stronger and more efficient bank.
Our capital has been further strengthened, and collective provisions as a ratio of credit risk-weighted assets has now increased to 1.4%. Same time, we have updated our software capitalization policy at the first half to reflect the more rapid pace of technology change, and we are reshaping our workforce to be both more efficient and to support better customer outcomes.
While each of these actions create short-term headwinds to performance, we are confident that they better position NAB to navigate a more dynamic near-term operating environment and deliver improved shareholder returns in the medium term. Business credit growth has been resilient and above long-term averages in recent years.
While we expect business credit growth to moderate to 8% in 2027, the long-term outlook remains positive, supported by key structural thematics, including ongoing investment in infrastructure, including digital infrastructure, property, energy transition, and supply chain resilience. This outlook is expected to provide good opportunities for growth in business banking at attractive returns.
NAB is the largest business lender in Australia, and business banking is our core. This focus has been a key driver of our earnings growth and shareholder outcomes.
The share of underlying profits from business banking, including in New Zealand, has now increased from 70% in fiscal '22 to 80% today. Over the same period, the cash earnings on risk-weighted assets for B&PB and C&IB combined have improved by 15 basis points.
This all supports our view that even with a more challenging year ahead where the cost of risk could remain elevated, our business bank can continue to earn through that and generate better returns than we would see in retail banking. Looking ahead to fiscal '27, we will maintain resilient balance sheet settings and a disciplined approach to risk management.
Our customers are managing an evolving environment, and we will support those that need us. We continue to focus on our three strategic priorities of growing business banking, driving deposit growth, and strengthening proprietary home lending, and this will be supported by increased alignment across all of our divisions.
The announced changes in our workforce, together with ongoing investment in tech modernization, will also help drive our efficiency. With strong tech foundations in place, we will scale AI safely to support our growth and productivity goals.
I remain confident in the long-term outlook of our business, the actions we have taken to improve our resilience and efficiency, together with our business mix and strong underlying momentum, position NAB to deliver sustainable growth and return for shareholders over time. Thank you again for your time this morning, and I'll now hand back to Sally for Q&A.
Sally Mihell
Thank you, Andrew. We'll now take questions from analysts and investors.
When it's your turn, the operator will introduce you. There are quite a few of you on the line today, we would appreciate it if you could limit yourselves to one question.
Please go ahead, operator.
Operator
Thank you. If you wish to ask a question, please press star one on your telephone and wait for your name to be announced.
If you wish to cancel your request, please press star two. If you're on a speakerphone, please pick up the handset to ask your question.
Your first question today comes from Victor German with Macquarie. Please go ahead.
Hey,
Victor German
thank you very much. I was hoping maybe Inder, a question for you, and maybe Andrew can also provide some context.
Mindful that you haven't provided specific guidance on expected benefits from the restructuring charge, and so any color would be useful. If I look at your expense walk, it appears that underlying cost growth is something in the order of 5% to 6%, even after allowing for the benefits of that you're likely to get from the restructuring.
Just be keen to understand if that is right, and also to the extent you can, if you can provide maybe a little bit of guidance and color on how you're thinking about your costs going into 2028, given that your underlying cost growth appears to be still fairly elevated in this environment. Thank you.
Andrew Irvine
Let me maybe just take a higher-level crack, and then you can go through some of the details, Inder, if that works, Victor. What I would say is we're seeking to reduce the kind of long-term recurring expense profile of our bank and of our business from something that was in the mid-to-high 4s to something under 3%.
We think we're taking a very significant structural reduction in the ongoing pace of cost pressure in the bank, and we're doing that while being very thoughtful to maintain the muscle in the bank and the productive capacity for our bank to win and compete, particularly in our business banking franchise. We just don't want to make sure that we hurt that productive momentum, and we've been really, really mindful of that.
What I would also say is that while we haven't given specific productivity guidance, I would expect that we will deliver productivity in '27 that will be more than we have ever done as a bank, and significantly above what we would have done in recent years. Part of that will be from the workforce adjustments that we announced, and part of that will be driven by the long-term productivity agenda that we have around simplification and modernization.
They would be my points, Inder, if you want to just follow.
Inder Singh
I think just to maybe respond to your specific question about the impact of the workforce changes we've announced. Clearly, we're still working through the specifics of many of those changes.
We've obviously made some announcements in relation to wave one. It's difficult to give you a specific number, but we're broadly assuming around $250 to $300 million of P&L impact booked in 2027 benefit from that, and we'd expect the run rate to be a little higher into '28.
One thing you've got to be mindful of is not all the changes relate to run costs, some of that will come through in terms of change costs, the profile in terms of capex/opex will then apply to that. Just to reiterate Andrew's point, we are focused very heavily on driving sustainable productivity.
To your points about the underlying run rate, we've been very clear on slide 26 setting out that the underlying run rate will be less than 3% in '27, and we would expect the restructuring charge and the cap software policy changes, which we've clearly called out on the slide, as largely non-recurring, so that gives you a sense of what we think the exit into '28 would look like.
Operator
Your next question comes from Richard Wiles with Morgan Stanley. Please go ahead.
Richard Wiles
Good morning. I'd like to ask a question about the outlook for loan losses.
Even if you exclude the pretty meaningful collective provision top-ups you took in the half, the underlying loan loss charge is about 15 basis points of loans. You've flagged signs of emerging customer stress, your watch loans have increased 15% or something like $1.4 billion in the past three months, and we've now had two rate hikes since the end of the half.
It suggests credit quality should get worse. How should we think about your watch loans as a lead indicator of loan losses, and what do you think will happen to the loan loss charge in FY '27, please?
Andrew Irvine
A couple of comments first from me, Richard, and then I'll let Inder elaborate. One thing that we have purposefully done as a management team in the half is improve our early warning signals and then speed up the transition of customers to watch and to our specialist business bankers in that part of our bank.
I would say about half of the increase in our watch loans was not due to underlying credit deterioration per se, but a change in our speed to move those customers into the watch book because we think it will deliver better outcomes for us and better outcomes for them. Maybe, Inder.
Inder Singh
I think in terms of commentary into 2027, I think the key moving parts, obviously we start with strong provision coverage at 1.4% of credit risk-weighted assets. We have taken some actions to uplift forward-looking provisions, both through sector-specific FLAs we've taken through the year and also through the adjustments to our economic assumptions and the weightings.
We feel that we're in a good position sort of exiting 2026 given the outlook we're facing into. In terms of underlying CP, there's a few drivers of that.
One is volume growth, and we would expect volume growth, whilst moderating, still to be pretty healthy particularly in business banking as we look forward. Then on credit quality, some of that watch list that Andrew was referencing earlier, we will see likely some transition into NPLs, but our transition rates, as I mentioned in my prepared remarks, still remain broadly consistent.
Then the individual IAPs are very difficult to predict. As we think about the component parts of the outlook, I think your points are fair, and I think we're just trying to give you a little bit of color around each of the moving parts.
Operator
Your next question comes from Jonathan Mott with Barrenjoey. Please go ahead.
Jonathan Mott
If I could just follow up from Walsy's question then, especially around the early warning tools. I think you mentioned this as well at the last result where you said you're encouraging your bankers to bring forward these watch lists.
What specifically are you talking about? Are you looking through the transaction accounts in your customers, are you looking through the accounting software to try and see where it's getting on?
Do you think you're ahead of your peers by doing this, by picking up more watch lists earlier in the cycle than your peers are?
Andrew Irvine
It's difficult to tell where peers are at, but I can certainly tell you that we have significantly enhanced our focus on exactly that, looking at transaction account balances, comparing them to either historic examples or prior periods for a customer to compare them and understand their cyclicality or seasonality, and then also compare them to industry peers. We're doing that very proactively, and the reason for that is we feel that we want to get customers with emerging signs of stress into the right place so we can work with them to best manage their business.
Importantly, most of these customers are still performing. I think our view here is the sooner we get them into watch, the sooner we can work with them to address the cash flow issues that they might be thinking, then hopefully we can actually reduce the transition to delinquency and into impairment that we would have seen in the past.
Inder Singh
Just one data point that's worth referencing is that the vast majority of exposures, I'd say more than 70% of exposures transferred to specialist business restructuring teams tend to be remediated and returned, and that's a really important focus for us is as we manage and work closely with customers, particularly in this type of environment.
Operator
Your next question comes from Brendan Sproules with Goldman Sachs. Please go ahead.
Hi,
Brendan Sproules
good morning. I just have some questions around your organic capital generation, and I'm referring to slide 30.
Just looking into the organic capital generation in '27, there just looks to be some challenging things emerging. Obviously, you're going to have almost 6% cost growth in the backdrop of slowing revenue on the cash earnings line.
Volumes are still going to be reasonably elevated, as you said 8% in the business lending. You're also seeing deterioration in the asset quality, as you have flagged here.
In terms of, I guess, how you sort of plan to manage that, if you get another 35 basis points decline, would we expect that you would again want to top up the capital, just given the environment?
Inder Singh
Brendan, it's a good question. Obviously, we've tried to make sure that we are very clear with the market on what the key drivers of capital generation are, and we're also talking to the fact that we're taking a lot of deliberate action around how we allocate capital across the business, how we position each of our portfolios.
You see some of that discipline kind of expressed through our positioning in home lending, for example, that Andrew talked through in his prepared remarks. We are also trying to make sure that the run rate of underlying costs does come down.
Yes, we've got some one-off charges in '27, but we feel pretty good about the trajectory into '28. Then an important area of focus for us is really to make sure we can drive greater value from the investment portfolio to make sure that that's driving improvements in revenue, reductions in costs, reduction in risk, and better customer outcomes.
I think there's a lot of focus internally in the organization on improving capital generation, and I think we're making some good progress. As you say, when you look at 2027, I'd say one thing to bear in mind is that '26 look-back does have quite a skew, first half/second half.
I'd say second half with somewhat moderating growth, organic capital generation was broadly neutral in the second half of 2026, so that gives us some good confidence as we've looked at the outlook. Obviously, we're starting with a good credit provisioning position.
Clearly, asset quality could be a risk from here. We have factored in, as I mentioned in my prepared remarks, that we will see some credit quality migration even if the economic base case that we've set out plays out.
Within our forecast assumptions, absent a really material deterioration in credit conditions, we believe that credit capital generation should be healthy into '27, and we feel the dividend settings remain appropriate.
Operator
Your next question comes from Andrew Triggs with J.P. Morgan.
Please go ahead.
Andrew Triggs
Oh, thank you. Good morning.
Inder, you just used the word discipline in response to that question, but NAB has been quite top-line focused in recent periods, which I think most would see the merit in, but you are the major bank with the lowest capital ratio. You have a more macro-sensitive book, and the growth settings are leading to quite a bit of cost pressure within the bank.
Are you not worried that the settings are, and maybe this is more for Andrew, too growth-focused? A cut in the dividend would provide you with arguably more discipline, and NAB has had a habit in the past of showing that discipline with constraints around capital.
Andrew Irvine
Look, I'll take that one if I could, Andrew. We are taking capital actions, and you can see us being incredibly rational and deliberate in our home lending book.
I know there's lower RWA density there, but we've been very uninterested in booking low-ROE lending onto the balance sheet, and that's going to continue. We feel very good about the fact that the business lending that we're originating and putting on the book in both our Corporate and Institutional Bank and in our Business Bank will deliver really good in excess of cost-of-capital returns to our shareholders.
We feel that that's a good reason to originate, and that shareholders would want us to do that versus to constrict that. We had a good discussion on our capital projections over the next kind of two or three years with our board, and we are confident that in the medium term, we can maintain the growth settings that we have as well as sustain the dividend payout ratio.
We do clearly have more near-term headwinds around that, which is why we have chosen to raise capital now as well as at the first half, but we think those are temporary, and that we'll be able to earn through that over time.
Operator
Your next question comes from Andrew Lyons with Jefferies. Please go ahead.
Andrew Lyons
Thanks, and good morning. Just a question on your ECL provisioning.
Your unemployment assumption appears to be 4.7% in September '27 and then 5% 12 months later, but you compare that to your macro team's assumptions that peak at 5.5%, which is a fair whack above the assumptions used in ECL. I do concede there are year-end timing differences, but just accounting for that, the gap does seem large.
Can you please maybe explain why there is that gap, and also perhaps what the sensitivity of your ECL outcomes are to your unemployment assumptions?
Inder Singh
Look, it's a good question. Obviously, it's a very dynamic environment, Andrew, in terms of where we think the outlook is heading.
When we look at our overall provisioning, we obviously look at it all together. I clearly appreciate that the economics team has just recently published an update.
You could look at that in isolation. It's unlikely to be a material delta to kind of our provisioning basis.
The way we'd look at it at period end is bring it all together because some of that stress that we're projecting through the forward-looking provisions might have already have come through some of the underlying components, whether it be through IAP or some of the credit migration in the underlying collective provisions. I think the way we would look at it is those three component parts I walked through earlier on, which is we'd bake in clearly the updated economic outlook, but within that we would look at where are our forward-looking settings at, both in terms of FLAs and EAs.
We'd have a look at what's come through in terms of IAPs, and then a top-up if required. Having taken a look at the economics team's most recent update, we don't think it's a material shift in our provisioning basis as reported at.
Operator
Your next question comes from Brian Johnson with MST. Please go ahead.
Brian Johnson
Thank you very much, and some really good disclosures in the pack. Just looking at slide 60, what I'm intrigued about is just that if we have a look at the profit delta in New Zealand, year-on-year and half-on-half, if we were to think about it, what do you think the outlook for New Zealand is, where we can see the margin collapsing, the loan loss charge increasing, the operating earnings falling?
Could we just get a feeling on the forward expectation there? Is it going to get better or worse?
Inder Singh
Thank you, Brian, and we will take any positive feedback on the disclosures, appreciate that. On New Zealand, slightly different economic outlook there.
I think they're probably seeing a somewhat better outlook next 12, 18 months than maybe they've experienced last 12, 18 months. Dan and the team have done a great job in building stronger foundations in the organization, investing and simplifying their product base, I think the business is very well set up.
Clearly, we're seeing quite a bit of competitive intensity in the margin in both asset margins and deposit margins. When you look at our net interest margin walk, you'll notice that we didn't call out any impacts from New Zealand.
Whilst we've seen probably about a 5 basis point impact in NIM in New Zealand standalone, that really hasn't lifted to a level that has impacted the broader NAB result overall. We actually feel pretty cautiously optimistic about New Zealand in terms of the trajectory on underlying profit and overall profit going forward, '26 into '27.
The foundations are strong. I think the team is managing really well through some of the competitive intensity.
We are growing both lending and deposits in mid-single digit run rates, and we feel that'll start to really translate through to better profit growth into '27. Your
Operator
next question comes from Matt Dunger with Bank of America. Please go ahead.
Matt Dunger
Thank you very much for taking my question. I wanted to ask about B&PB.
The 6% half-on-half income growth you saw included both margin expansion, volume growth, wondering how sustainable you think this is given the front book economics. Andrew, you're talking about allocating more capital to higher-returning businesses.
Assumedly, this is B&PB, and can you talk to existing versus new-to-bank client opportunities there?
Andrew Irvine
Look, thanks for the question. We are continuing to see good opportunities to deploy capital at attractive returns in the Business Bank.
We're consciously also working to increase our share of proprietary lending in Business and Private Banking, which we actually were able to do over the half, and that provides us with better opportunities to increase share of wallet with those customers, which we feel is important. Look, at this stage, while we do expect credit growth to moderate from very high levels this year, they'll still be 7% or 8% next year, which is, I think, very constructive.
We will make sure that we compete on proposition, not just price. We, I think, have really good pricing processes in the Business and Private Bank.
When things get a little too rich for our liking, we're prepared to walk away. More often than not, where we have banked a customer for a long period of time, they don't leave the bank on price and price alone, and they need to have had a service failure, or a credit underwriting issue, or a poorly managed change-of-banker episode to want to leave us.
Lastly, you asked the question on where are we seeing the opportunities. I'd say the vast majority of growth would be within our existing franchise clients, and backing them to continue to grow.
Operator
Your next question comes from Tom Strong with Citi. Please go ahead.
Oh,
Tom Strong
good morning, and thanks for taking my question. First, a question for you, Inder.
Another very solid year for markets and treasury income, with revenue $1.9 billion, led by the treasury side in particular. Can you just give us a guide into '27, do you think the revenue base for this side is structurally higher, or there is an element of mid-cycle that we should factor in?
Inder Singh
Good question, Tom. Obviously very pleased with the performance in markets and treasury for the full year.
As we look back, that business has really stepped up from an average run rate of around $1.5 billion if you look at on a five-year average. I'd probably say that as we look into '27, we feel pretty good around a run rate of around that $1.7, $1.8 billion a year as being relatively sustainable going forward.
Look, there's clearly always one-offs in any single year, but I'd probably point more to some level of step-up from the average that we've seen over the last five years as we get into next year.
Operator
Your next question comes from Matthew Wilson with Jarden. Please go ahead.
Matt Wilson
Good morning, team. Matt Wilson, Jarden.
Again, back on asset quality, I think it's pretty clear we're going into a cycle. We haven't seen one of these for a long time.
How do you see the risks emanating out of the private credit space? The slowdown there impacting your ability to manage your watch list down further, that escape valve seems to have closed.
Is there a warehouse exposure that we should be aware of in the private credit space? There will be the contagion effect of lower asset values as they move through workouts in the coming months?
Then linked to that, you touched on it, but you didn't give a sensitivity. NAB has given sensitivities in the past.
I remember giving us one back in the COVID time. Talking about risk-weighted inflation in Common Equity Tier 1, if we saw non-performing loans go from 0.34 to 0.5%, still very low levels, how would that actually impact Common Equity Tier 1?
We need to see some sensitivities now.
Andrew Irvine
I'll take the first question around private credit, and I'll let Inder respond on the capital sensitivities from the second part of your question. Look, on private credit, there is no doubt that we've seen private credit become much more judicious in their origination patterns in the last few weeks and months.
Liquidity has dried up. We are seeing much less refinancing out of our watch or stressed credit positions to private credit.
That was a source of, you could argue, good-quality refi-out activity, and that has slowed. We'll have to see whether or not that picks up going forward.
I think the thing that I do worry about is customers that have material exposure to private credit, and how they will have to act in terms of managing their asset positions, and if they're forced to divest assets at low asset values, what can that do to kind of create a further downward pressure on property prices in particular. That's something we are actively watching.
Inder Singh
On the asset quality and the credit migration, what we can share with you, Matt, is that if the economic base case that we've set out plays out, we would expect AQ-related RWA increases to be around $6.5 billion through the course of FY '27. To give you some sense, in the last half, we probably saw RWA impacts from AQ of around $2.5 billion.
That number is netted off in some of the other movements we've shown on the chart, but we expect that to be higher when you look at FY '27 both half-on-half and for the full year.
Operator
Your next question comes from Ed Henning with CLSA. Please go ahead.
Ed Henning
Hi, thanks for taking my question. I might want to ask one on margins.
Can you just go through a little bit more detail on some of the outlook comments on the margin? In this half, you call out 1 basis point benefit from rate rises.
We've had one at the end of September and one again this week. Is there 2 basis points there, you've got kind of 5 basis points including your replicating portfolio, or is that included in the deposit and replicating portfolio?
Then also if you look at the headwinds on the lending margin, last half it was 2 basis points in housing and 2 basis points in business. This half was one and one.
You talked about ongoing competition. Kind of what levels of competition are you thinking about just ongoing from kind of this half?
Also, mix again was a headwind in this period. You haven't called it out in the considerations.
Do you think that's still going to be a headwind going forward as well, please?
Inder Singh
Look, good question, and happy to walk through some of the component parts. I think let's take the 3 basis points tailwind on replicating portfolio as a starting point.
I think on your point about cash rate movements, we are not that sensitive to cash rate increases coming through in the P&L because most of that really comes through our replicating portfolio. Whilst we have seen some cash rate increases, you can even see the impact on the current half is that the benefit coming through the unhedged deposit book is modest, and there's obviously also a cash rate lag on the lending side.
I'd probably say on overall cash rate increases, we're probably more neutral net-net when you look forward to the outlook. I think on lending margins, we've said 1 basis point each from business lending and home lending in the current half.
We've sort of felt that the competitive intensity has been broadly stable, particularly in business lending. We've probably seen an uptick in home lending after the budget changes have been announced, and we'd expect that to probably continue, although we are being thoughtful about how we participate in that space.
How much of that really translates to our book is to be seen. On the deposits, I think the key call-out for us has been that yes, we are seeing a shift to TDs, and we called out that mix impact in the second half, and we'd probably expect that 1 basis point or so to be relatively reflective of what we see going forward.
We're not seeing a material impact in terms of overall cost of deposits at this point.
Operator
Thank you. There are no further questions at this time.
I'll now hand back to Sally Mihell.
Sally Mihell
Just like to thank everyone for joining. The Investor Relations team will be available throughout the day if you have any follow-up questions.
Thanks.