Komatsu Ltd.
Q2 FY2027 · Earnings Call TranscriptOctober 29, 2026
Hiroshi Hosotani
I am Hosotani, CFO. I will now explain our results for the second quarter of fiscal 26, which has just ended.
Page 4 summarizes our second quarter results for fiscal 26. Exchange rates were 159.4 yen per U.S.
dollar, 183.7 yen per euro, and 112.2 yen per Australian dollar. The yen weakened against all three currencies year-on-year.
Sales rose 13.6% year-on-year to 1 trillion 115.5 billion yen. Operating income fell 1.2% to 135.1 billion yen.
The operating income ratio fell 1.8 percentage points to 12.1%. Net income rose 13.3% year-on-year to 95.8 billion yen.
Sales reached a record high for the second quarter. Page 5 shows second quarter sales and profits by segment for fiscal 26.
Construction, Mining and Utility Equipment sales rose 15.1% year-on-year to 1 trillion 32.6 billion yen. Segment profit fell to 114.3 billion yen.
The segment profit ratio fell 2.2 percentage points to 11.1%. Retail Finance sales rose 7.2% year-on-year to 32.7 billion yen.
Segment profit rose 3% to 7.7 billion yen. Industrial Machinery and Others sales fell 2.9% year-on-year to 61.6 billion yen.
Segment profit rose 28.4% to 12.1 billion yen. Page 6 shows second quarter sales by region for Construction, Mining and Utility Equipment in fiscal 26.
Sales rose 14.9% year-on-year to 1 trillion 28.8 billion yen. Excluding foreign exchange effects, sales rose 5.9%.
The following pages explain regional changes separately for mining and construction equipment. Page 7 shows second quarter mining equipment sales by region within Construction, Mining and Utility Equipment in fiscal 26.
Mining equipment sales rose 8.5% year-on-year to 502 billion yen. Excluding foreign exchange effects, sales fell 1.4%.
Sales rose sharply in Latin America, where copper mining demand was firm, and in Africa, where gold mining demand was firm. In Asia, sales fell in Indonesia as coal-related demand remained weak.
Sales also fell in Oceania as the replacement demand cycle ran its course. Overall, sales fell excluding foreign exchange effects.
Page 8 shows second quarter construction equipment sales by region within Construction, Mining and Utility Equipment in fiscal year 2026. Construction equipment sales rose 21.9% year-on-year to 526.8 billion yen.
Excluding foreign exchange effects, sales rose 13.7%. Sales rose in every region except China, including North America, where data center investment drove firm demand, and Latin America, where infrastructure investment supported firm demand.
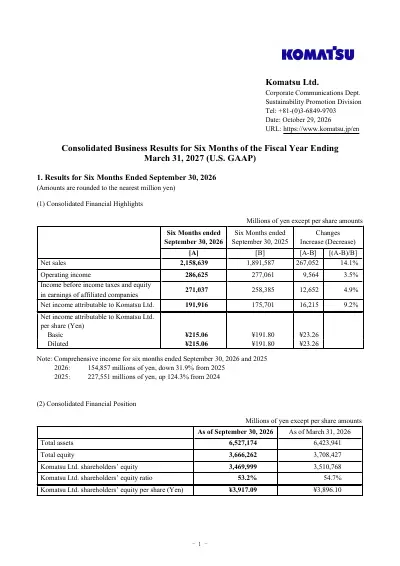
Page 9 summarizes our first half results for fiscal 26. Exchange rates were 159 yen per U.S.
dollar, 184.2 yen per euro, and 112.4 yen per Australian dollar. The yen weakened against all three currencies year-on-year.
Sales rose 14.1% year-on-year to 2 trillion 158.6 billion yen. Operating income rose 3.5% to 286.6 billion yen.
The operating income ratio fell 1.3 percentage points to 13.3%. Net income rose 9.2% to 191.9 billion yen.
Sales reached a record high for the first half. Page 10 shows the sales and profit for each segment for the first half of fiscal year 2026.
Sales of Construction, Mining and Utility Equipment increased by 14.8% year-over-year to 1 trillion 999.6 billion yen. Segment profit rose by 1.0% to 244.5 billion yen, and segment profit margin decreased by 1.7 percentage points to 12.2%.
Revenue for Retail Finance increased by 7.3% year-over-year to 65.4 billion yen, and segment profit went up by 2.9% to 17.4 billion yen. Revenue in Industrial Machinery and Others segment rose by 7.1% year-on-year to 114.5 billion yen.
Segment profit was up by 27.0% to 21.1 billion yen. Now, I'll explain the factors behind the changes in each segment later.
Moving on to page 11, this represents the regional sales figures for the Construction, Mining and Utility Equipment segment for the first half of fiscal year 2026. Sales of Construction, Mining and Utility Equipment increased by 14.8% year-over-year to 1 trillion 993.8 billion yen.
Excluding the impact of foreign exchange rates, sales were up by 4.8%. Details on the year-over-year changes by region are provided on the following pages with breakdown by mining equipment and general construction equipment.
Here on page 12 shows regional sales figures for mining equipment within the Construction, Mining and Utility Equipment segment for the first half of fiscal year 2026. Sales of mining equipment grew 11.0 11.0% year-over-year to 964.4 billion yen.
Excluding the impact of foreign exchange rates, sales growth was 0.2%. In Asia, sales fell significantly in Indonesia, where demand for coal-related equipment remained sluggish.
On the other hand, sales were up in Central and South America, where demand for copper mining equipment remained strong, as well as in Africa and North America, where demand for gold mining equipment was robust, resulting in an overall revenue increase. Page 13 represents regional sales for the general construction equipment within the Construction, Mining and Utility Equipment for the first half of fiscal year 2026.
Sales of the general construction equipment reached 1 trillion 29.4 billion yen, an increase of 18.6% compared to the same period last year. Excluding the impact of foreign exchange rates, sales were up 9.5%.
Except Japan and the Middle East, sales increased in all regions such as North America, where demand remained strong, driven by data center investment, and Central and South America, where demand remained strong, supported by infrastructure investment. Turning to page 14, this demonstrates the factors contributing to the changes in sales and segment profit for the Construction, Mining and Utility Equipment segment in the first half of fiscal year 2026.
Sales increased by 257.4 billion yen year-over-year, driven by foreign exchange gains from the weak yen, higher sales volume, and the positive impact of improved selling prices. Segment profit increased by 2.5 billion yen, as the positive effects of the weak yen, higher sales volume, and improved selling prices outweighed the negative factors such as rising costs.
The segment profit margin decreased by 1.7 percentage points to 12.2%. Additionally, the impact of tariffs for the first half of fiscal year 2026 amounted to a negative 39.7 billion yen, while refunds totaled 12.8 billion yen; a net amount of negative 26.9 billion yen is included as a negative impact on cost variance.
Next, page 15 shows the status of retail finance for the first half of fiscal year 2026. Assets increased compared to the end of the previous fiscal year due to an increase in new business volume.
New financing volume increased year-over-year, primarily due to increased use of financing in North America, Europe, and Africa. Revenue and segment profit increased by 4.4 billion yen and 500 million yen, respectively, compared to the same period last year, primarily due to the impact of the weak yen and expansion of assets.
Page 16 shows you the sales and segment profit figures for the Industrial Machinery and Others segment for the first half of fiscal year 2026. Net sales rose 7.1% year-over-year to 114.5 billion yen.
Segment profit increased 27.0% to 21.1 billion yen. The segment profit margin rose 2.9 percentage points to 18.4%.
Sales to the automotive industry declined, while sales to the semiconductor industry grew. Overall, both sales and profit increased.
Turning to page 17, it represents the consolidated balance sheet and free cash flow. Total assets amounted to 6 trillion 527.2 billion yen, an increase of 103.2 billion yen compared to the end of the previous fiscal year, primarily due to an increase in inventory.
Inventory asset totaled 1 trillion 694.7 billion yen, an increase of 92.8 billion yen. The equity ratio decreased by 1.5 percentage points to 53.2%.
The net debt-to-equity ratio stood at 0.31. Free cash flow for the first half of fiscal year 2026 resulted in a net inflow of 20.3 billion yen.
Furthermore, free cash flow for the full fiscal year 2026 is projected to result in a net inflow of 270 billion yen. The share buyback program approved at the Board of Directors meeting on April 28th, 2026, was completed by September 15th, 2026, with shares purchased up to the maximum limit of 100 billion yen.
This concludes my presentation. Next, regarding the projections for fiscal 26, Mr.
Hishinuma will explain.
Kiyoshi Hishinuma
I'm Hishinuma, General Manager of the Business Coordination Department. I will now explain our fiscal 26 outlook and conditions in our main market.
Page 19 summarizes our fiscal 26 business outlook. We are raising our sales and profit forecasts from the full-year outlook announced on July 29th, reflecting the latest market outlook and actual second quarter exchange rates.
We are raising our sales forecast by 148 billion yen from July to 4 trillion 450 billion yen, up 7.7% year-on-year. We are raising our operating income forecast by 30 billion yen to 585 billion yen, up 3.1%.
Our net income forecast is going to be raised by 33 billion yen to 382 billion yen, up 1.5%. Reflecting recent price trends, we revised the cost increase from the Middle Eastern situation from 23.2 billion yen to 21.7 billion yen.
Reflecting the latest developments—oh, this is year-over-year impact. Reflecting the latest developments, we also revised the cost increase from U.S.
tariffs from plus 25.8 billion yen to plus 17.7 billion yen. We have also revised parts of our demand outlook, which I will explain later.
Our exchange rate assumptions from the third quarter onward are unchanged from July: 150 yen per U.S. dollar, 174 yen per euro, and 106 yen per Australian dollar.
Full-year averages will be 154.5 yen per U.S. dollar, 179.1 yen per euro, and 109.2 yen per Australian dollar.
We expect ROE of 11% for fiscal 26. We plan a dividend of 190 yen per share, unchanged from last year and our July forecast.
Including the effect of share buybacks, we expect a consolidated payout ratio of 44.2%. Page 20 shows sales and profit forecasts by segment.
For Construction, Mining and Utility Equipment, we expect sales of 4 trillion 120 billion yen, up 8.2% year-on-year, and segment profit of 504 billion yen, up 2.6%. For Retail Finance, we expect sales of 129.5 billion yen, up 2.7% year-on-year, and segment profit of 36.5 billion yen, down 0.2%.
For Industrial Machinery and Others, we expect sales of 257.5 billion yen, up 7.9% year-on-year, and segment profit of 44 billion yen, up 16%. I will explain the drivers of changes in each segment later.
Page 21 shows our fiscal 26 sales forecast by region for Construction, Mining and Utility Equipment. We expect sales of 4 trillion 92.3 billion yen, up 7.8% year-on-year.
Excluding foreign exchange effects, we expect growth of 4.4%. The following pages explain regional changes separately for mining and construction equipment.
Page 22 shows our fiscal 26 mining equipment sales forecast by region within Construction, Mining and Utility Equipment. We expect mining equipment sales to rise 4.8% year-on-year to 1 trillion 996.7 billion yen.
Lower sales in Asia due to weak coal-related demand and in the Middle East due to regional conditions will be offset by higher sales in Latin America, where copper mining demand is firm, and Africa, where gold mining demand is firm. Excluding foreign exchange effects, we expect sales to be broadly flat, up 0.9% year-on-year.
Page 23 shows our fiscal 26 construction equipment sales forecast by region within Construction, Mining and Utility Equipment. We expect construction equipment sales of 2 trillion 95.6 billion yen, up 10.8% year-on-year.
Excluding FX effects, we expect growth of 7.9%. We expect lower sales in the Middle East due to regional conditions.
However, we expect overall year-on-year growth with gains in regions including North America, where data center investment is driving firm demand, and Latin America, where infrastructure investment is supporting firm demand. Page 24 shows actual and projected sales of equipment parts, services, and other items in Construction, Mining and Utility Equipment.
In the second quarter of fiscal 26, parts sales rose 11.7% year-on-year to 291.1 billion yen. Total aftermarket sales, including services and other items, accounted for 53% of sales.
Excluding foreign exchange effects, total aftermarket sales rose 4.9%. For fiscal 26, we expect parts sales of 1 trillion 117.7 billion yen, up 5.9% year-on-year.
Total aftermarket sales, including services and other items, should account for 51% of sales. Excluding FX effects, we expect total aftermarket sales to rise 1%.
Page 25 shows the drivers of projected changes in sales and segment profit for Construction, Mining and Utility Equipment. We expect sales to rise 314 billion yen year-on-year, driven by the weaker yen, higher volume, and improved selling prices.
We expect segment profit to rise 12.9 billion yen, as the benefits of the weaker yen, higher volume, and improved selling prices outweigh higher costs and other negative factors. We expect the segment profit ratio to fall 0.7 percentage points to 12.2%.
The fiscal 26 cost variance includes a negative tariff impact of 44.8 billion yen and refunds of 27 billion yen, for a net negative impact of 17.7 billion yen. Page 26 shows the Retail Finance outlook.
We expect assets to rise 40 billion yen from the previous fiscal year-end due to an increase in new contracts. We expect new contracts to rise 106.5 billion yen year-on-year due to greater use of financing in North America, Europe, Oceania, and Africa.
We expect sales to rise 3.4 billion yen year-on-year, mainly due to our larger asset base. We expect segment profit to be broadly flat year-on-year, mainly due to higher costs.
We expect ROA to fall 0.1 percentage points year-on-year to 2.3%. Page 27 shows the sales and segment profit outlook for Industrial Machinery and Others.
We expect sales of 257.5 billion yen, up 7.9% year-on-year, and segment profit of 44 billion yen, up 16%. Sales to the automotive industry are expected to fall, mainly due to lower sales of large presses.
Sales to the semiconductor industry should rise as customers increase production. Overall, we expect both sales and profit to increase.
We expect the segment profit ratio to rise 1.2 percentage points to 17.1%. From page 28, I will explain demand trends and the outlook for our seven major products.
Demand figures for the seven products include mining equipment. The second quarter fiscal 2026 figures are preliminary Komatsu estimates.
Second quarter fiscal 2026 unit demand appears to have risen 6% year-on-year. As in the first quarter, firm demand in North America and Latin America drove overall growth.
Recently, demand in Asia, as well as North America and Latin America, has exceeded our initial expectations. Reflecting these conditions, we have revised our full-year fiscal 2026 demand forecast to growth of 5% to 10% year-on-year.
Page 29 presents the trends and outlook for demand in North America market. Demand volume for the second quarter fiscal year 2026 appears to have increased by 14% year-over-year, driven by data center investment.
Demand for rental units rose significantly, while demand from the mining and energy sectors also remained strong. The full-year demand forecast for fiscal year 2026 has been revised from the July projection and is now projected to be 5% to 10% higher than the previous year.
While we expect data center investment to continue driving demand, we also closely monitor the impact of rising energy prices and interest rates on demand. Page 30 covers demand trends and outlook for European market.
Demand in the second quarter of fiscal year 2026 is estimated to have increased by 2% year-over-year. Large-scale infrastructure projects in Germany and the UK are driving demand.
While we maintain our full-year demand forecast for now, we will continue to closely monitor future demand trends, including the potential impact of rising interest rates on demand for construction equipment. Page 31 covers demand trends and outlook for the Asian market.
Demand in the second quarter of fiscal year 2026 is estimated to have increased by 8% compared to the same period of the previous year. In Indonesia, demand from the agriculture sector remained solid.
Meanwhile, for mining machinery, although demand rose among certain customers who received additional coal production permits, overall demand remained sluggish due to uncertainty surrounding future production permits. In India, demand for construction machinery has remained robust, supported by public works projects and economic growth.
In other Asian countries, while demand for construction equipment softened in some nations due to the impact of rising energy prices, overall demand remained firm, supported by factors such as public investment. Allowing for these factors, the full-year demand forecast for fiscal year 2026 has been revised from the projection made in July and is now expected to be on par with the previous year's.
Now, page 32 represents demand trends and outlook for Japanese market. Demand in the second quarter of fiscal year 2026 is estimated to have declined by 2% compared to the same period of the previous year.
While we maintain our full-year demand forecast, we are currently seeing a recovery in demand both from general customers and the rental sector, supported by factors such as increase in private sector construction investment. Page 33 presents trends and outlook for the prices of key minerals that influence demand for mining equipment.
Copper prices remained high, supported by robust demand. Gold, which is currently undergoing temporary correction, which continues to hold at a high level from a long-term perspective.
Thermal coal prices for both low-grade, high-grade varieties are currently on upward trend, probably due to the surge in crude oil prices driven by the situation in Middle East. We continue to closely monitor future developments.
Page 34 shows demand trends for mining equipment. Demand in the second quarter of fiscal year 2026 is estimated to have increased by 5% versus the same period last year.
Demand from copper mines in Central and South America, as well as from gold mines in Africa and North America, has remained robust. Consequently, overall demand for mining equipment is expected to exceed our initial projections.
In light of these developments, we have revised our full-year demand forecast for fiscal year 2026 previously issued in July to a range of 0% to -5% year-on-year. Next, I'll outline some key topics.
Page 47: Komatsu and Earthbrain have entered into a strategic partnership covering the Japanese and U.S. markets with AI Machine—with AIM Intelligent Machines, a developer of autonomous operation technology for bulldozers and hydraulic excavators.
By integrating construction plans and target terrain data created via Smart Construction within AIM's physical AI platform, the partnership will enable autonomous construction operations. AIM's technology can also be retrofitted onto existing bulldozers and hydraulic excavators.
Moving to page 48: Komatsu has agreed to extend its global partnership with the Williams F1 team. The two companies will further deepen their technical cooperation, with Komatsu engineers providing support for the development of key components to be used in the future Williams F1 cars.
Turning to page 49: Komatsu has launched the PC75-10M0, a 7-ton-class hydraulic excavator designed for the Southeast Asian market, which is developed and manufactured by its Indian subsidiary, Komatsu India. This model marks the first time Komatsu India has taken the lead in developing a hydraulic excavator.
It leverages the company's development, production, and procurement capabilities in India to meet the specific needs of the Southeast Asian market. Komatsu is strengthening its ability to flexibly provide products tailored to the needs of customers in each region, and this model was developed as part of that ongoing initiative.
Page 50: Komatsu has launched the PC200-11M2 and PC210-11M2 hydraulic excavators, and has begun their phased our phased introduction into emerging markets, primarily in Asia. By offering the PC200-11M2, the second model in CE, civil engineering, series designed with enhanced cost efficiency for urban civil engineering work, alongside the versatile PC210-11M2, which is suited for a wide range of job sites, Komatsu enables customers to select the model best suited to their specific needs.
Moving on to page 51: In September, Komatsu publishes integrated report, Komatsu Report 2026. The report reviews the first year of our mid-term management plan, our strategic growth plan, Driving Value with Ambition, and outlines initiatives aimed at enhancing corporate value over the medium to long term, including efforts in automation and remote operation, the application of AI, development of human and natural capital.
We invite you to take a look. That concludes my presentation.
Operator
Now, we would like to move on to Q&A. First, we would like to receive questions from the people who are here with us.
Maekawa-san from Nomura?
Kentaro Maekawa
This is Maekawa from Nomura Securities. Thank you very much for the presentation.
I have two questions. Regarding your full-year projections and tariff costs that you were anticipating, in your previous plan for the year, you were saying 89.1 billion, which was an increase of 25.8 billion year-on-year.
This time around, when you look at page 25, it's 44.8 billion, it has been increasing. Of course, sales in North America, including demand, has been revised upwards, I presume that volume is increasing and that's the reason why, but even so, I kind of feel that is relatively high.
Can you talk about the reasons why?
Hiroshi Hosotani
Tariff impact, right? What we have accounted for with respect to tariff impact, where we show the P&L changes, for the 44.8 billion, this is before refunds.
After refunds, it's 17.7 billion. And 25.8 billion was actually after refunds.
The actual net amount of impact has actually gone down. We have accounted for the recent developments and we have revised the numbers.
Tariff impact is actually down on a net basis.
Kentaro Maekawa
Sorry for that. My second question is also with respect to full-year expectations and selling prices.
When you look at the progress of the second quarter, it seems that the profit increase magnitude has been declining compared to the first quarter. For construction equipment in North America, as well as mining in Latin America, as well as Asia, apparently, it seems that you have revised up both demand and sales expectations for the three regions.
With inflation still underway, I think you are at a point where you need to continue to raise selling prices, but why is your expectation relatively low, and what are you doing to address this situation?
Operator
Hosotani will take your question.
Hiroshi Hosotani
For this fiscal year and the regular price increases, we have accounted for this in our expectation and there's no changes there. We will continue to engage in regular price increases by region.
On the other hand, as we strive to raise prices when it comes to tariff cost, there are some companies partially that has been including the tariff impact into their selling price increase, which is a North American company, but tax credits with its application, which is mainly for auto industries, there is no need to raise prices any longer. The magnitude of price increases had been declining.
Compared to July, half of that difference is accounted for by this region. For the rest, although this depends by region, but the regions where interest rates are up in order to support marketing activities locally, we have been offering incentives and marketing support, which is slightly higher compared to July.
Although it varies region by region, the selling price impact, positive impact apparently looks like it's lower than before.
Kentaro Maekawa
This incentive, marketing support, in which regions are you increasing this? Your main markets are like North America, Latin America, Indonesia, and Asia, those regions were a positive.
Are you doing this in the Asian regions, although you have revised up your expectations?
Hiroshi Hosotani
No, for the regions where interest rates are higher. For example, that would be Europe.
We have been increasing support by a bit.
Kentaro Maekawa
Okay. In North America, what about additional price increases?
Do you have any intention of doing that?
Hiroshi Hosotani
Originally, we will continue to do the price increases that we were planning for initially, but when it comes to large support, no, we have not been doing anything specific like that.
Kentaro Maekawa
Thank you.
Operator
I'll take next question: Sasaki-san from UBS.
Tsubasa Sasaki
Thank you for your presentation. This is Sasaki from UBS Securities.
Thank you for this opportunity. My first question, you showed me the variance.
You have the volume and the mix gap, and can you show us with the gap? Also the product cost, and as Maekawa-san question in the Middle East and conflict in the Middle East and so forth had that pushed impact, but versus initial plan, I think the product cost has increased.
Why? Thank you.
Hiroshi Hosotani
This is Hosotani speaking. In the first half, what first half versus the initial plan, for fiscal 26 first half, in the first half, 1.6 was included.
Then mix, what region and also product were both included, but combine all of them, 11 to 12 billion were included. Now, I'll explain why and what.
In terms of the region, versus previous year, Asia declined significantly. Versus world total average, the profitability in Asia was relatively good.
The regions are seeing declining, there are some the regional mix. In terms of the product mix, this is just about cost.
The sales increase in first half, but primarily coming from the CE. It's evident if you look at the bar graph, the equipment for CE is growing.
Parts does growth versus previous year, but equipment going more than parts. In terms of the mix, equipment mix is larger.
In terms of the product mix, we need to account for the negative factors. That explains the first half.
Also the production cost, 20.4 billion yen we are showing right now, sorry, 46.9 billion, and U.S. tariffs are included of the 26.8, 20 billion some a remainder.
Then the breakdown of 20 billion, that procurement risk from the Middle East, and this is conventional message we have repeated, this has been included. Also in terms of the region, that was a flood in Thailand.
That was a one-off event, and one-off cost was included. Also supplier overseas and claim expense occurred.
That was just again, one-off. Steel material versus previous year, the pricing of the steel material ticked up, and this part of the increase was included, too.
Those are some of the items we should explain for first half. I guess you asked the question of the full-year basis.
Full-year basis, now looking at 21.8 billion yen, the volume product mix, 20 billion yen of negative of product mix were included. The same trend goes for Asia, and on an annualized basis, it declines.
That was part of the negative factors from the region. Other than the regional reason, in the first half, as I said, the overseas suppliers driven warranty-related expense, the cost was up, it was included here.
Also, we need to respond to the flood in Thailand, those are one-off costs we needed to include. Other major chunks, in terms of the mix, sales mix, equipment, especially for CE equipment, and CE parts mix.
In terms of the mix, we are seeing negatives here. Volume increases, and then volume mix is included, so that's how we can explain this volume mix, too.
Then production cost, a breakdown of that, the U.S. tariffs shown up here on slide, others, 34 billion yen, we originally included the Middle East-related expense, this was huge, this was around 13 billion, which was pretty big.
Other than that, steel material, copper, aluminum, and these commodity prices are going up. Also this time, semiconductor price tag increased, from the previous year, semiconductor cost increase was one more item we needed to include.
All in all, these are some of the cost increases we are witnessing right now. That's all from me.
Tsubasa Sasaki
Thank you. Then production cost, Middle East impacts and the U.S.
tariff cost are include decreasing, but other parts and commodity cost increases, those are enormous, is that what you're saying?
Hiroshi Hosotani
Yes.
Tsubasa Sasaki
Thank you. My second question, in Asia, especially in Indonesia, there is no full recovery yet, but I'm not sure where you are at the moment in Indonesia market.
Please give me updated. Also, what are the dormant ratio?
What are the feedbacks or comments you're hearing from the people on the front lines in Indonesia? What does the outlook look like?
Once again, taking this opportunity, please quantify the outlook and the overview of Indonesia market. That was my second question.
Kiyoshi Hishinuma
This is Hishinuma speaking. First, Indonesia market, right?
4,200 some prices what have been seen, but rather than that, cost, that's one thing we need to highlight here. For coal price, $50 sometime before, but recently, $70 or some or the upper $70.
The demand is supposed to go up with that price tag, but as I said from the beginning of the year, production permits for 2025, 800 million tons, but then post Q1, 600 million tons, that was a drop we see. Then that was expected to go up to 720 million, this is based on calendar year, and we just handful months to go.
For anywhere that can gain the permits for production, and some of the customers are trying to purchase the equipments, so that drives the demand to an extent. Also the commercial streamlining, and that could be some chuckles for the businesses, but that started to recede back.
In terms of the mindset, they started to relax, but the dormant ratio, post Q1, it was around 20%, that's how I explained, but as of September, 12% to 13%. The dormant ratio dropped that much.
It looks like it's getting better, but we need to really look into the figures or behind those figures, because the population units is constant, and then dormant ratio goes down, and that means the utilization ratio is supposed to go up, but the population itself declines in some areas. I'm not sure if it will be resold or others, but some are making movements like that.
Those developments or have been seen. We need to look into those developments moving forward.
Also, coal production permits volume, 720 million tons, that's where we expect that to go back, but then if we turn to 2027 calendar year, at best, I think the volume will be the equivalent level to that, so that warrants our attention.
Tsubasa Sasaki
Very clear. Thank you.
Operator
Thank you for the question. Let's move on to the next one.
Isayama-san from Goldman Sachs Securities, please.
Yuichiro Isayama
Thank you for the presentation. I'm Isayama from Goldman Sachs.
For North America and construction equipment that you did well on, I'd like to ask you a question around it, including some basic questions. You raised your demand outlook, but when you look at monthly numbers, I kind of thought it could be better because you're saying just plus 5% to 10%.
Why is it this low? Are you just being conservative?
Of course, there's various things happening currently like higher rates and so forth, but I would like to hear from you why you set your projections this way, because I think you could be more confident. When you compare your sales to demand, it seems that you are performing really well, are you taking more market share?
Is the mix improving? Are you seeing more added value or profitability?
Can you talk us through what's happening in North America in detail?
Kiyoshi Hishinuma
This is Hishinuma. This year, it's all about data center investors.
That's what we've been communicating with respect to North America this year. For Q1, non-residential, where data centers are included, as well as rental that is driven by this demand has been strong.
That's what we've been saying. Currently, activity around data centers happen quite quickly.
When it comes to non-residential new original equipment purchases, it's not growing that much. Customers want the equipment to come to their sites as soon as possible.
That is why they are preferring to rent the equipment nowadays. In the demand outlook, if you look at the page that I explained, rental has been growing predominantly.
When you talk to customers, it's not as if everyone is saying so, but depending on the customer, they have order backlog in place that is on an annual level. We believe the strength is likely to continue for a while.
We think that looking at results from the first half, the second quarter was plus 14%, and for the first half, it was plus 15%. Of course, there are other external factors like what's going to happen to energy prices.
I don't want to talk about any political things, but we do have the elections coming up, and therefore, we are applying a cautious view leading to these numbers. For sales, we recognize sales based off wholesale to distributors.
Talking about rental that I have been talking about before, we have DURF, what is distributor-owned rental fleet, that is counted in market share. The distributors rent equipment that we sell equipment to, but that is not included in share count.
When the rental equipment is replenished, our wholesales will increase.
Yuichiro Isayama
Thank you. Going back to what you just explained, can we talk about next year?
It may be a little bit too early, but when you look at your order backlog, are you expecting that this demand is going to decelerate because of rental, or because there is a certain level of backlog, do you think it's likely to continue? It might be too early to ask this question, but people question how long the data center-related investments are going to last and so forth, can you share with us your view?
Kiyoshi Hishinuma
We have been gathering customer feedback, and obviously, there are some bullish people out there, but we are still scrutinizing the details, we're not yet at a point where we can share our outlook for next year.
Yuichiro Isayama
Second question is with respect to the changes part. You talked about some one-off costs as well as mix.
Towards next year, if you can provide us with some food for thought, that would be great. Can you sort things out for us?
First, due to the flooding in Thailand, there were some one-offs, and also the drop-off in tariff impact, and for Asia, if it's negative this year, is it going to be positive next year? Is North America construction equipment going to continue to grow and serve as a positive next year?
I felt in this update in your guidance that a lot of negatives are going to be taken care of during this fiscal year, which may turn positive next fiscal year.
Hiroshi Hosotani
Thank you for the question. This is Hosotani.
For this fiscal year and the changes in our P&L, I did explain some one-off expenses, especially regarding the mix for construction equipment and original equipment sales, it has been growing, which is obviously impacting positively profit growth. When you analyze the profits, there are some negative impact from mix.
Looking out into next year, compared to our assumptions for equipment, including construction equipment, it's a matter of original equipment and parts balance. If the balance changes, that will impact mix as well.
Is the mix tentative this year and is going to change next year? That's something I will not be able to talk about today.
Next, with respect to costs, there were some year-specific items like what we talked about regarding Thailand, as well as there were some quality issues with overseas suppliers that led to higher cost. Also for steel and materials like that, we do expect high levels presumably to continue next year, but obviously, there will be some materials where costs go down.
For costs, by aligning together with the production people, we will be focused on reducing cost and controlling cost, which is what we do every year, but obviously, we'll be doing this next year as well. That's all from me.
Yuichiro Isayama
I'm so sorry. With copper mines growing, and if the U.S.
picks up and Asia bottoms out, I don't think that sounds bad, but are there any concerns? Meaning shortage of materials, that's often talked about in other sectors, but are there any negatives that you are anticipating next year?
Kiyoshi Hishinuma
Related to mining, right? That's your question?
Yes, I'm thinking that mining will turn positive and there's no negative catalysts that we should be aware of. Yes.
For Latin America, it's mainly around copper mines, and it is growing. For Africa, we have gold as well as some copper, which is growing, too.
This is in linkage with AI or data centers. Data centers require a lot of power.
On top of data centers, these power stations are being built as well. As a result, whether it be electric cables or otherwise, copper demand is heightening.
AI, data centers, power infrastructure, and copper demand has been heightening, and we believe this will be ongoing. For copper, therefore, there aren't many factors that may lead to a copper price decline.
Copper procurement cost is not that cheap. It really depends on negotiations.
Also, semiconductors demand is extremely high right now, and demand is increasing, even when you look at the market from the general level. We are obviously in the same position as an entity that buys copper, we will have to cooperate together with the supplier to try to bring the cost down.
Yuichiro Isayama
Thank you.
Operator
Taninaka-san from SMBC Nikko Securities.
Satoshi Taninaka
This is Taninaka from SMBC Nikko Securities. I got two questions.
First, North American short-term sales outlook. I appreciate if you can drill down a bit more.
In reality, ex-FX, what's the growth rate like? Sales growth rate, if I do the math, then first half North American sales growth rate was 5% for mining equipment, and second half negative 6% YoY.
First half is great, but second half is expected to decline. For CE, first half, 20% growth for CE, but negative 1% year-over-year basis in second half.
As you have been saying, you try to be cautious probably, but if you look towards second half, it looks like a sales volume decline YoY basis. Whether it's ME or CE, what are the risks you are aware of at the moment?
Takuya Imayoshi
This is Imayoshi speaking. First, for mining equipment, we're a large client, obviously, there are some ups and downs, which is out of our control.
As for CE, I find it difficult to describe.
Satoshi Taninaka
You're saying that there are a variety of risks?
Takuya Imayoshi
Yes, including product mix. If we add up everything we know, then this is what it looks like.
As we have been explaining, data center are driving demand, which is so true, and the rental market is taking center stage for driving growth, and everybody is bullish, yes, but for first half, that's the number we are putting at the moment.
Satoshi Taninaka
Okay. My second question.
CE sales in Asia was revised upward because of that. I think that could be some implications from that.
Ex-sales growth rate was 18.8 billion yen of revision upward in Asia for CE, and the growth rate was negative 11% to negative 1%, which looks very stable and robust. You're saying that agricultural sector was robust, what's the situation like in Asia?
What are the things that are turning around in Asia, if so? Product mix, I think that there could be some positive impacts from product mix.
If there's any impacts on the product mix with this upward revision?
Kiyoshi Hishinuma
This is Hishinuma speaking. First, in Asia, Indonesia, agricultural part, yes, I explained that, but on the other hand, in mining, B50, we need to use B50, as and palm oil was pretty robust and active in the market, and then that drives demand, that's one thing.
Second thing, public investment. The beginning of the fiscal year, public investment budget has been replaced by school food or lunch-related budgets, it's not that the private investment budget is not declining.
Including all of that, I think the situation looks a little bit better than what we had anticipated. In terms of the mix, unfortunately, it's not that profitable mix is increasing significantly.
Satoshi Taninaka
It was clearer. Thank you.
That's all from me.
Operator
Thank you. Next, we would like to take some questions from Zoom.
This is Otake from Nikkei. Can you hear me?
Operator
Yes, we can. Please go ahead.
Thank you for taking my question. My first question is about tariff impact from the U.S.
In consideration of the current circumstances, you changed your outlook to 17.7 billion. When you say the current conditions, what do you specifically mean?
Going forward, depending on the circumstances, do you feel that you will be able to reduce the impact from tariffs even more? That's my first question.
Kiyoshi Hishinuma
This is Hishinuma speaking. When we say the current conditions, we do purchase from U.S.
suppliers. We go into detail to negotiate with the importers as well.
When you build things up, we see what we have currently. Compared to our initial expectation, due to 301, our expectations were too strong or conservative.
After three or six months, we didn't see that much of an impact. Those are the things we have accounted for.
That's what I meant.
The supplier thing you talked about and negotiations, if you see more progress, will you be able to mitigate the tariff impact even more?
Kiyoshi Hishinuma
It's not really like we're going to try to do something more than what we have. It may have been 100%, but we're looking at 5% or 10%.
To be honest, I am not engaged in the negotiation process, there may be some adjustments, but I am not sure.
I see. The audio was cut off on my end, I just wanted to confirm one thing regarding demand trends in North America.
For data centers, you've been saying the rental segment has been performing well. You have revised up your outlook for North America.
When you were talking about demand outlooks by region, is this demand being driven by rental?
Kiyoshi Hishinuma
This is Hishinuma speaking. Yes, basically, it's data centers.
In Q1, non-residential and rental was driving the way. From a demand point of view, competitors are carrying DURF in the rental space, that is accounted for in the share count, and demand-wise, the growth was quite substantial.
However, we don't use DURF. In the case distributors are going to do rental, it is being owned by them, and it's not included in the share count.
However, we will be able to grow our sales due to wholesales. That's why there is some contradiction between demand and sales trends.
It's not necessarily consistent, but we basically sell our products, and our distributors will do rent-to-sell, and they might have been able to make a sale to data center applications. In that case, our non-residential share count will increase.
From a retail ratio point of view, the non-residential ratio is drawing close to one-half, and that is driven by data center-related demand.
I see. One follow-up question I have is earlier, you were saying that there are some distributors that have backlog on an annual basis.
As you communicate with distributors, are there any cases where inventory levels are trending low? What is the inventory situation?
Kiyoshi Hishinuma
This is Hishinuma. We're not talking about distributors for order backlog, we're talking about the end user.
For distributors, because the rental business is doing well right now, rent-to-sell inventories are being built up, and that is why we're seeing higher sales.
Rental inventory for distributors, is it running low?
Kiyoshi Hishinuma
No, not really. It's not as if it's running low compared to normal levels.
I see. Thank you very much.
Operator
Thank you. Again, participant from Zoom, Mr.
McDonald from Citi,
Graeme McDonald
thank you.
Operator
Do you hear me speak?
Graeme McDonald
This is McDonald. Yes, I hear you.
For the interest of time, I'd like to have a first question on the returns to the shareholders. Today, the second upward revision was made, and ROE level was upward revision came, it's not substantial, but cash flow was revised upward, too, for second time, but the dividend and the buyback in April, that amount stayed at the same level.
In terms of the shareholder returns policy, yes, I understand, but what kind of messages would you like to convey? Because there are various factors of anxieties, but would you like to do more of the shareholder returns or buyback, can we expect more down the road?
Hiroshi Hosotani
Imayoshi-san, can you comment on that?
Takuya Imayoshi
This is Imayoshi speaking. Yes, following Q1, we made a revision upwards in Q2.
In Q1, it was more like the Middle East conflict was incorporated generally, we try to be updated. Then based on that, we needed to revise upward of that performance.
Then it's been six months after initial planning, we need to be based on the current situation, and the yen gets weaker, FX impact was incorporated up to Q2. This growth of the revision itself is not that substantial, but we try to be accurate based on our current market.
In terms of the returns to shareholders, as you see here, the level of the dividend, the 40% plus of dividend payout ratio, and we are 44%, and this is within the range of this light revision, it's not that we have discussion on the change of the dividend amount itself.
Graeme McDonald
Can you clarify? FX-wise, spot-wise, the yen gets weaker, and there are uncertainties a lot, yes, but probably three months out, slight revision could be possible.
I think it's fair to say that we can expect some returns to shareholders at around that time. You've been conservative, and yes, that's a kind of the stance you're taking in general, I understand that, but I think that you can be more proactive.
Kiyoshi Hishinuma
Imayoshi-san, what do you think?
Takuya Imayoshi
In terms of the policy for dividend, Investor Relations department hear a lot of feedbacks from the other and shareholders and investors. As McDonald, as we have explained before, we haven't changed our stance of the Komatsu Group.
As of today, it's not that the current conditions significantly altered. Also towards second half and towards fiscal 27, there are more uncertainties coming along.
Putting everything into perspective, we didn't change that level. I appreciate if you can understand that.
Graeme McDonald
The different topic. Recently, Latin America copper mines projects were firm, but mining companies in Latin America talk to me, and August and September, there were heavy rains, and then that drops the production activity, and there were some accidents because of landslides, and there's some negative news coming in.
Do you think it was a one-off? Do you think it was some influential for your performance?
I'd like to clarify if that's true.
Takuya Imayoshi
Yes, we are aware of those situation, but in terms of the business, there has been no material impact. It's not that we have incorporated any of that from Latin America into this guidance.
As explained, copper demand is pretty brisk, and also investment activities on the part of clients is expected to be stable for a while.
Graeme McDonald
Thank you. That's all from me.
Operator
We'd like to continue to take questions from the floor. Tai-san from Daiwa Securities, over to you.
Hirosuke Tai
This is Tai from Daiwa Securities. This might be a very rough question, but the first one is when you compare Q1 and Q2, and it could be just limited to the CE business, I think profitability went down quite a lot.
What caused this decline the most? How should we view this?
Q-on-Q, the yen depreciated somewhat, and sales volume increased, I guess it's mix worsening or material cost increasing? I'm not sure.
You don't have to walk me through the exact numbers Q-on-Q, but as a story, volume went up, profitability went down this much because of what? If you can give me a brief answer, that will be helpful.
That's my first question.
Hiroshi Hosotani
This is Hosotani. Q-on-Q profitability difference, first as a factor was the way fixed costs came through.
On a quarterly basis, the beginning of the year, we weren't seeing that much development of executing on our budget, but as the year progresses, typically, fixed costs increases. One more thing specific to the second quarter was the flooding in Thailand, as well as the overseas suppliers tentative cost burden that happened, so that was an extraordinary item.
Not sure if this wasn't a material, but the refund timing of tariffs. In the first quarter, the amount of refunds were bigger, in Q2, the amount that impacted P&L was smaller, which has had a negative impact.
Those are the two major factors.
Hirosuke Tai
The impact from Thailand, as well as the overseas suppliers, how much was the impact if you combine the two together for the second quarter? It's less than 10 billion.
About 9 billion?
Hiroshi Hosotani
It's about 5 5 billion, to be exact.
Hirosuke Tai
I see. For the second half of the year, your plan is that profitability is going to pick up again.
If you add back 5 billion, we should be able to expect profitability improvement from Q2 going into the second half, but material costs are likely to increase, the mix doesn't seem like it's going to improve right away, and fixed costs are going to be heavier in the second half compared to the first, which means are you all right in profitability improvement in the second half of the year?
Hiroshi Hosotani
Whether we can do it or not, with respect to that, often our company is said to be conservative, but we do put together plans by looking at the details closely. We are expecting more volume in the second half of the year compared to the first half, we should expect profit growth through higher sales volume.
For fixed costs, when you compare the first and second halves, the second half is likely to have a higher fixed cost base. When you compare sales, second half sales is likely to grow more.
To be even more specific, for the first half, due to ships not operating in line with schedule, there has been some shipping push-outs from the first half into the second half of the year. Our expectation that sales is going to be higher in the second half is backed up by conviction.
Hirosuke Tai
Thank you. One more last thing I would like to ask about is fiscal 27 and mining demand.
How do you project this? Can you say a word on this?
For Indonesia, Hishinuma-san spoke about it earlier, if Indonesia were to be flattish, for copper or for gold, there's various positives underway, but for total demand, it's been several years of not-so-great trends. Commodities have been up, but operational costs have been up as well, and it may be because investments are not being made that commodities are up.
Is mining demand going to pick up next year? That will lead to better orders and sales.
The mix will probably be extremely better, and we should be able to project a brighter next year. Should we be optimistic or not as optimistic and be more prudent?
Hiroshi Hosotani
For the mining majors, as far as we talk to them, for 26, as well as for 27, their CapEx plans are neither going up or down. We're expecting it to be flattish.
We have not accounted for this completely in our plan, but we have started to see orders for 27 come in by a certain extent, but we're not expecting a big development next year. Of course, our business plan is going to be compiled from here on, I can't talk about the details, but that's the level we are anticipating based off what we've been hearing from them.
For underground, with all the products in place, I think you're in a position to be more on the offense. Even if demand were be like that, isn't there any additional business you think you could go after, or a story like that?
It can be Hishinuma-san or Imayoshi-san. For orders or business negotiations, we continue to have them with customers.
The fluctuation in sales by fiscal year tends to be determined by delivery timing. If we're able to ship during this year, we might end up seeing good results at the end of the year.
We may see some push-outs into next year, and in that case, it will be recorded as next year's sales. We are not seeing any changes in environment that is changing the amount of orders we're seeing come in.
Operator
Thank you. Anyone from the floor?
Morgan Stanley MUFG, Kitamura-san, please.
Takeshi Kitaura
This is Kitaura from Morgan Stanley MUFG. Thank you for today's presentation.
My first question, the mining equipment, I think this might overlap a little bit, but as I hear that Chinese players are really aggressive in coming to this part of the market, by commodity, for example, for copper, I think you're strong, seeing no problem, and for example, in the first half in Oceanian region, sales in mining equipment dropped. Can you talk a little bit about it?
Has it something to do with the competitive landscape and do you see difficulty in raising prices? I appreciate if you can give us update of the mining equipment market.
Kiyoshi Hishinuma
This is Hishinuma speaking. Oceania was a bit feeble in mining equipment, overlapping a little bit as I just said, but delivery timing and business negotiation are swaying.
Previous year, that was a bumper year. Versus the fiscal 25, this year was not as great as fiscal 25.
Then it's not to say that Oceanian market is cooling. No, we are not worried about that market.
Chinese players, people on the front lines are struggling a lot. In mining equipment, it's not that there are significant threat from China.
For example, the part of a flat area for coal, then within which the dump truck of China started to come in, that's what I started to hear. What about on pricing?
Isn't there any influential impact from China? Because the way we're playing the game is a bit different from them.
Takeshi Kitaura
Okay. My second question on mining, BB ratio, it started to tick up a bit.
In comparison to sales, you said that you expect them to be flattish, but the copper were robust. If you look at the BB ratio, what's the trend like by commodity base?
I appreciate if you can disclose those data sets, too.
Kiyoshi Hishinuma
Again, this is Hishinuma speaking. This is a BB ratio showing up on a screen.
This is six months to six months we try to divide those numbers. For example, one the order coming in great, then BB ratio goes up, and then for a while, that goes to delivery, then even though the order was pretty good and BB ratio goes down, this is kind of repetitive move you're seeing.
We're seeing robust, but started to pick up a bit.
Takeshi Kitaura
What about by minerals? Set aside Indonesia, what about copper?
Kiyoshi Hishinuma
Yes, the copper is the most robust one, or gold. These are robust and brisk.
Takeshi Kitaura
Thank you.
Operator
Thank you. Next from Zoom, Kusunoki-san from Nikkan Kogyo Shimbun.
This is Kusunoki speaking. Can you hear me?
Operator
Yes, we can. Please go ahead .
Regarding my first question, it's about interest rates. In September, the BOJ increased rates to 1.25%, and their policy is to continue to hike.
For companies, it's likely to lead to higher funding cost. For your company, how do you view this impact on the business environment or your performance?
Takuya Imayoshi
This is Imayoshi speaking. There isn't going to be a material impact on our business.
As we disclose on our balance sheet, our liabilities are mostly associated to the retail finance business, and basically, we charge customers based off variable rates. We'll need to be watching closely the impact on economies around the world, because when interest rates go up, housing starts tend to decline, and also it tends to have an impact around infrastructure, too.
For Japan, at that magnitude, I don't think it's going to have a material impact. Far, currently, orders continue to come in, over the short term, we are not feeling its impact.
Of course, over the medium term, we will need to watch closely to discuss about our outlook for next year.
Thank you. Another question I have for you is about cybersecurity.
Cyberattacks to companies are intensifying. How do you perceive these trends?
Can you share with us your policies around cybersecurity, and if you have any priorities you are placing, can you share that with us?
Takuya Imayoshi
Yes, this is Imayoshi. This is one of our utmost important themes that we are looking at, and we are deploying our resources as well.
Fortunately, we have not experienced an incident where we were attacked and our information was breached. However, by leveraging AI, attacks are becoming more sophisticated, and they have been evolving, we would like to leverage tools that are available to us that are state of the art so that we can prevent attacks from happening.
Thank you.
Operator
We're seeing time is ticking, the next question will be the final one. Anyone who has questions?
Narita-san from Mizuho Securities.
Issei Narita
This is Narita from Mizuho Securities. Just one thing to clarify, the refunds of tariff in first half, 12.8 billion.
Q1, 10 some billion yen, then 3 billion is the only amount we're seeing. Then that could have impact on Q-on-Q comparison.
In a full-year basis, 30 billion yen will be going to 27 billion yen, so that's declining according to your plan. As you recognize those, do you think those figures will be coming in the second half?
Can you clarify and can you confirm those numbers change?
Hiroshi Hosotani
Yes, this is Hosotani speaking. Yes, you're right.
On an annualized basis, what's impacting P&L, 27 some billion yen. I'm giving you more details here.
Annualized basis, refund amount will be larger than this, 28 billion some yen, that's what we are expecting. Originally, in April, I said that 30 billion yen of the refunds, against which if we examine the details, then that's the latest amount.
So 1 billion some yen will remain as an inventory, and this will have impacts on next year's performance. First half gap will be coming out in second half.
Does that answer your question?
Issei Narita
Yes, thank you.
Operator
Thank you. We would like to now conclude the Q&A session.
This concludes Komatsu's fiscal 26 Q2 results briefing. Ladies and gentlemen, thank you for joining today.