Dyno Nobel Limited
Q4 FY2026 · Earnings Call TranscriptNovember 8, 2026
Tom Dixon
Good morning and welcome to Dyno Nobel Limited's 2026 full year results briefing. This is Tom Dixon speaking, and I'm joined this morning by our CEO and Managing Director, Mauro Neves, and our Group CFO, Nitesh Naidoo.
The materials we will be covering today have been lodged with the Australian Securities Exchange and are available on the ASX and Dyno Nobel websites. At the end of the presentation, we'll have time for questions, and an audio recording will also be made available on the company's website.
I'll draw your attention to the disclaimer on slide 2 and slide 3 of the presentation. Before we move into the main presentation, I'd like to begin with an acknowledgement of country.
I acknowledge the traditional owners of the land, sea, and waters across the various locations that we are living and working from today. I pay my respects to elders past and present.
Thank you. I'll now hand over to Mauro.
Mauro Neves
Thank you, Tom. Good morning, everyone, and welcome.
Nitesh and I are pleased to present Dyno Nobel's 2026 full year results. I'll start with our 2026 highlights and the outlook for fiscal year '27.
Then I'll cover our progress on safety, our transformation, and the next drivers of growth: new markets, premium technology, and energetics. Nitesh will then take you through our financial performance, capital investment, balance sheet, and shareholder returns.
I'll return with our closing remarks on why we believe in Dyno Nobel's future, then we'll take your questions. Let me begin with the results and how we're building a stronger basis for growth.
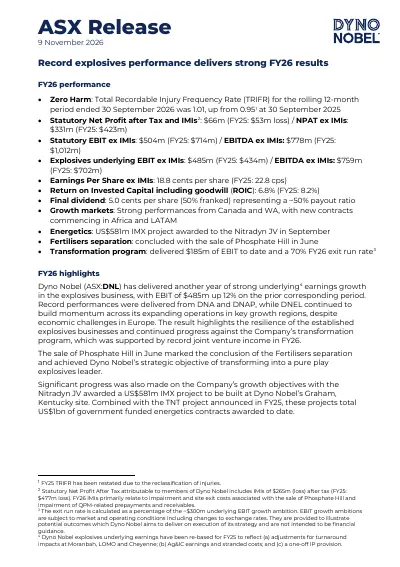
Fiscal year '26 was a strong year for Dyno Nobel. Our explosives business delivered a record result with underlying EBIT of $485 million, up 12% year-on-year.
We delivered on our financial year '26 commitments. Our transformation program generated $51 million in net benefits.
At year-end, our exit run rate stood at 70% of our $300 million EBIT uplift ambition. We completed our move to a pure-play explosives company.
The sale of Phosphate Hill marked the final step in separating our fertiliser business. Safety and reliable delivery remain our foundation.
In the second half, we recorded zero process safety incidents and saw a clear improvement in TRIFR. In our growth markets, we won new customer projects in Ghana, Tanzania, Brazil, Canada, and Western Australia.
Our privileged assets and vertical integration continue to create advantage. The Moranbah debottlenecking project is complete, and Cheyenne remains on track for completion in the first quarter of financial year '27.
We also made tangible progress in energetics, with approximately $1 billion of US government-funded TNT and IMX projects now progressing at Graham, Kentucky. Such results keep us on track for our $600 million EBIT ambition in financial year '28.
By the end of financial year '27, we expect our exit run rate to reach about 85% to 95% of our uplift ambition. Safety comes first, today and always.
Our full year TRIFR was 1.01 compared with 0.95 in financial year '25. That's not where we want to be, but it does not tell the full story of our progress throughout the year.
TRIFR fell from 1.25 in the first half to 0.77 in the second half. Strong leadership in the field, early identification of hazards, and a sharper focus on high-risk work began to deliver results.
Process safety also improved. Incidents fell by 81%, and we recorded zero process safety incidents in the second half.
No incidents were classified as serious harm in financial year '26. At 80% of our sites, there were no recordable injuries.
Injury severity fell by 41%. We also recorded no major environmental incidents.
We welcome this progress, but the work's not done. Our TRIFR target remains 0.76.
We will keep building the leadership, systems, and behaviours required to achieve zero harm for everyone, everywhere. Now to the financial results.
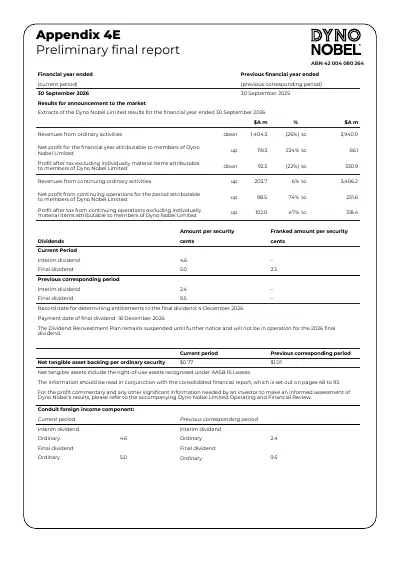
Group revenue was $3.941 billion. EBIT was $504 million, excluding individually material items.
Our statutory profit after tax, including IMIs, was $66 million. That compares with a loss of $53 million in the previous period.
Group revenue and earnings reduced year-on-year as we reshaped our portfolio through the sale of the fertilisers. The clearest measure of the ongoing business is the Dyno Nobel explosives result.
Explosives revenue rose 10% to $3.406 billion. EBITDA rose 8% to $759 million.
Underlying EBIT increased 12% to a record $485 million. ROIC, excluding fertilisers, rose from 5.2% to 6.7%.
This reflects a stronger explosives business and the impact of turnarounds in financial year '25. We returned $574.4 million through our buyback program at an average price of $3.01 per share.
We have announced a final dividend of 5 cents per share, bringing total financial year '26 dividends to 9.6 cents per share—9.6 cents per share. At year-end, net debt to EBITDA was 2.1 times, within our policy range.
For financial year '27, we expect underlying EBIT of about $515 million to $555 million, subject to the assumptions and risks set out in this presentation. The transformation program delivered $51 million in net benefits during financial year '26.
Commercial actions made the largest contribution. New customer wins, repricing, and wider use of our premium technology delivered $51 million.
Priority growth markets added $19 million. Changes to how we operate, buy, and manufacture also delivered gains across our cost base.
These gains were partially offset by $55 million in temporary headwinds and other impacts. These included about $40 million from foreign exchange and $11 million in added depreciation.
Inflation also had an impact. Unplanned downtime at Cheyenne and supply limits from the Walgett turnaround accounted for about $16 million.
The core drivers of our transformation remain intact: better contracts, firm pricing discipline, stronger manufacturing, and growth in markets where we can win are delivering results. In financial year '27, we expect another $30 million to $70 million in net transformation benefits.
Priority growth markets offer the largest opportunity. New contracts will start in Africa and Latin America, with further growth in Canada, Asia, and WA.
We expect a further $20 million to $30 million from our commercial actions. These include customer wins, repricing, better product bundling, and wider use of premium technology.
Manufacturing, supply chain, and procurement actions are expected to add up to $15 million. We will unlock more production capacity through debottlenecking and improved efficiency.
About $25 million in offsets will reduce those gains. These include scheduled maintenance at Moranbah and our foreign exchange assumptions.
In this table, you can see our progress since financial year '23. From financial year '24 to '26, we delivered $185 million in net transformation benefits.
Commercial benefits totalled $154 million gross. Operations added $83 million, and growth markets added $59 million.
Against those gains, we had $111 million in offsets: depreciation, stranded costs, inflation, and temporary operating impacts are examples of such offsets. Underlying explosives EBIT rose from $300 million in financial year '23 to $485 million in financial year '26.
We exit financial year '26 with a run rate of $510 million. That puts us at 70% of our $300 million uplift ambition.
By the end of financial year '27, we expect that run rate to reach about 85% to 95%. We remain on track for the $600 million ambition in financial year '28.
This is not the result of any single action; it comes from stronger commercial delivery, lasting changes to our operations, disciplined growth, and a more focused business. As we showed in our recent Investor Day, we see five powerful megatrends supporting long-term growth across our markets.
Electrification and the energy transition are driving critical minerals demand, with copper material moved expected to grow by around 50% from 2021 to 2031. Supply chain security is also driving investment, with around $30 billion mobilised for critical minerals reshoring in the United States.
At the same time, more than $1 trillion of AI-related infrastructure investment is projected over the next 3 to 5 years, supporting demand for commodities, material, and energy. Declining ore grades, down an estimated 6% to 8%, are increasing the need for productivity, technology, and technical expertise.
In defence energetics, the market is expected to double by 2035, creating a compelling adjacent growth opportunity. Importantly, each of these trends aligns closely with our capabilities and competitive strengths we have, giving us confidence in the long-term outlook for our business.
Our growth is gaining traction through customer wins in metals and in the priority regions we shared at our Investor Day. Metals rose 17% in '26 measured by revenue.
The share of explosives revenue grew by 4 percentage points. In North America, metals revenues rose 29% as we brought in new customers.
Canada delivered revenue growth of more than 40%. New operations including Agnico Eagle's Hope Bay and Skeena's Eskay Creek.
In Australia, we won more than 10 new hard rock sites over the past 12 months. We continue to grow our presence in WA.
In Asia, the capital-light model is now operating in Malaysia. We see further opportunities in PNG, the Philippines, and India.
Across Africa and Latin America, we won four new sites, including projects in Ghana, Tanzania, and Brazil. These wins show that we can achieve when we bring together global customer ties, strong local delivery, and technology that sets us apart.
In Africa and Latin America, we are moving from winning contracts to setting up operations and delivering services. In Ghana, services began in September at AngloGold Ashanti's Obuasi and Iduapriem operations.
Local emulsion production in Iduapriem is planned for the first quarter of financial year '27. In Tanzania, services at Geita are expected to begin as the on-site unit is brought into service this quarter.
In Peru, we aim to bring the Ilo emulsion plant into service, also in the first quarter of financial year '27. In Brazil, operations at Vale's Fábrica site are also expected to begin before the end of calendar year.
These leading global customers give us a firm base for growth in these regions. Our approach is disciplined and makes careful use of capital.
Premium technology helps us deliver more value to customers, better quality revenue, and stronger earnings. Electronic initiation system volumes increased 11% in financial year '26, as customers continued to convert from legacy systems and new customer wins supported further adoption.
Our premium products earned margins about 1.2 times those of standard products. They help customers improve productivity, rock fragmentation, and operating performances.
Use of Nobel Fire rose 19%. Customers are making greater use of digital tools to plan, carry out, and improve their blasting.
The aim is not simply to sell more product; it's to deliver more value to customers and build earnings that are stronger and more resilient. The Autonomous Bench shows technology strategy in action, solving real problems for customers.
The solution is designed to automate dipping, priming, loading, and stemming while allowing operations to be supervised from a control room. This keeps people away from high-risk areas, supports continuous operations, and uses data to deliver more consistent blasting results.
The autonomous equipment has now been built. With our partner, Marampa Mines, we plan the first site trial by mid-2027.
This solution is a key part of a fully autonomous mining operation. Other customers are already showing early interest in the technology.
This is a practical demonstration of how our proprietary technology, digital capability, and customer partnerships can create a meaningful competitive advantage. Energetics opens a new path for growth alongside our core business.
Our assets, expertise, and operating systems give a strong base to compete. At Graham, Kentucky, two US government-funded projects are building that new growth platform.
The TNT project is worth $435 million. The IMX project is worth $581 million.
Together, they represent about $1 billion in government-funded investment at Graham. The IMX project is being delivered through Nitradine, our 50/50 joint venture with Pelchem, combining Dyno Nobel's manufacturing capability with Pelchem's defence contracting expertise.
The value goes beyond a new source of earnings. The TNT and IMX facilities will strengthen US security of supply, increase vertical integration, and reduce our reliance on imported critical raw materials.
The model is designed to deliver recurring earnings through product margins on off-take or tolling fees on government demand. The TNT project is moving through detailed engineering, permits, and site preparation.
First production is expected in late 2028. First IMX production is expected by 2030.
Our financial year '31 group ambition of $800 million EBIT includes about $30 million to $40 million from North American energetics. At Graham, the IMX project takes us into advanced energetics material.
The project includes five modular plants, making materials such as RDX and HMX. These can be used on their own or as components of IMX-104.
This gives us more ways to serve governments, defence contractors. It also allows us to supply raw materials for our own commercial use or for sale.
In Europe, [Vonges?] gives us an established base with a long history in energetics and deep technical expertise.
European demand for energetics is expected to roughly double between 2026 and 2035. More manufacturing capacity will be needed.
We are exploring a new energetics facility at [Vonges?] .
Off-take talks are moving forward with potential customers in Europe and NATO-aligned customers. Process and engineering options remain under evaluation, and the next stage will define the preferred concept, development pathway, and commercial approach.
We will remain disciplined and progress opportunities where our capabilities create a clear advantage and where the returns justify the investment. I will now hand over to Nitesh, who will cover the financials.
Nitesh Naidoo
Thank you, Mauro, and good morning, everyone. In this section, I'll take you through the FY '26 financial performance, investing activities, and the balance sheet.
I'll finish with the FY '27 Dyno Nobel outlook. On slide 22, FY '26 was a strong year for the Dyno Nobel business, and we exit the year on track to deliver the $600 million EBIT ambition in FY '28.
We spoke to you about the next horizon of growth to FY '31 and our 800 ambition, but recognise the first step is 600 by FY '28. Underlying explosives EBIT increased 12% to $485 million, driven by record performances in DNA and DNAP.
Our strategic joint ventures also performed strongly. JV income increased 16% year-on-year to $93 million, and JV tax-adjusted EBIT across the explosives business reached $518 million.
I'll talk more about JV tax effect later in the section. The transformation program delivered $51 million of net benefits in FY '26, taking the exit run rate to 70% of the $300 million uplift ambition.
Explosives revenue increased 10%, supported by long-term customer relationships and a forward contract order book of around two times FY '26 revenue. That forward coverage does not include energetics and provides a strong visibility over the underlying revenue base.
Moving to 23. The business has built strong momentum since FY '23.
Underlying EBIT has increased from $300 million to $485 million, representing compound annual growth of around 17%. ROIC has improved by approximately 90 basis points over the same period, with FY '26 explosives ROIC at 6.7%.
Underlying EPS for the explosives business has increased from around 7 cents in FY '23 to 18 cents in FY '26, supported by earnings growth and the share buyback program. Our forward contract value is an important metric Tom Dixon: Good morning and welcome to Dyno Nobel Limited's 2026 full year results briefing.
This is Tom Dixon speaking, and I'm joined this morning by our CEO and Managing Director, Mauro Neves, and our Group CFO, Nitesh Naidoo. The materials we will be covering today have been lodged with the Australian Securities Exchange and are available on the ASX and Dyno Nobel websites.
At the end of the presentation, we'll have time for questions, and an audio recording will also be made available on the company's website. I'll draw your attention to the disclaimer on slide 2 and slide 3 of the presentation.
Before we move into the main presentation, I'd like to begin with an acknowledgement of country. I acknowledge the first peoples of the land, sea, and waters across the various locations that we are living and working from today.
I pay my respect to elders past and present. Thank you.
I'll now hand over to Mauro. Thank you, Tom.
Good morning, everyone, and welcome. Nitesh and I are pleased to present Dyno Nobel's 2026 full year results.
I'll start with our 2026 highlights and the outlook for fiscal year '27. Then I'll cover our progress on safety, our transformation, and the next drivers of growth: new markets, premium technology, and energetics.
Nitesh will then take you through our financial performance, capital investment, balance sheet, and shareholder returns. I'll return with our closing remarks on why we believe in Dyno Nobel's future, then we'll take your questions.
Let me begin with the results and how we're building a stronger basis for growth. Fiscal year '26 was a strong year for Dyno Nobel.
Our explosives business delivered a record result with underlying EBIT of $485 million, up 12% year-on-year. We delivered on our financial year '26 commitments.
Our transformation program generated $51 million in net benefits. At the end, our exit run rate stood at 70% of our $300 million EBIT uplift ambition.
We completed our move to a pure-play explosives company. The sale of Phosphate Hill marked the final step in separating our fertiliser business.
Safety and reliable delivery remain our foundation. In the second half, we recorded zero process safety incidents and saw a clear improvement in TRIFR.
In our growth markets, we won new customer projects in Ghana, Tanzania, Brazil, Canada, and Western Australia. Our privileged assets and vertical integration continue to create advantage.
The Moranbah debottlenecking project is complete, and Cheyenne remains on track for completion in the first quarter of financial year '27. We also made tangible progress in energetics, with approximately $1 billion US dollars of US government-funded TNT and IMX projects now progressing at Graham, Kentucky.
Such results keeps us on track for our $600 million EBIT ambition in financial year '28. By the end of financial year '27, we expect our exit run rate to reach about 85% to 95% of our uplift ambition.
Safety comes first, today and always. Our full year TRIFR was 1.01 compared with 0.95 in financial year '25.
That's not where we want to be, but it does not tell the full story of our progress throughout the year. TRIFR fell from 1.25 in the first half to 0.77 in the second half.
Strong leadership in the field, early identification of hazards, and a sharper focus on high-risk work began to deliver results. Process safety also improved.
Incidents fell by 81%, and we recorded zero process safety incidents in the second half. No incidents were classified as serious harm in financial year '26.
At 80% of our sites, there were no recordable injuries. Injury severity fell by 41%.
We also recorded no major environmental incidents. We welcome this progress, but the work's not done.
Our TRIFR target remains 0.76. We will keep building the leadership, systems, and behaviours required to achieve zero harm for everyone, everywhere.
Now to the financial results. Group revenue was $3.941 billion.
EBIT was $504 million, excluding individually material items. Our statutory profit after tax, including IMIs, was $66 million.
That compares with a loss of $53 million in the previous period. Group revenue and earnings reduced year-on-year as we reshaped our portfolio through the sale of the fertilisers.
The clearest measure of the ongoing business is the Dyno Nobel explosives result. Explosives revenue rose 10% to $3.406 billion.
EBITDA rose 8% to $759 million. Underlying EBIT increased 12% to a record $485 million.
ROIC, excluding fertilisers, rose from 5.2% to 6.7%. This reflects a stronger explosives business and the impact of turnarounds in financial year '25.
We returned $574.4 million through our buyback program at an average price of $3.01 per share. We have announced a final dividend of 5 cents per share, bringing total financial year '26 dividends to 9.6 cents per share—9.6 cents per share.
At the end, net debt to EBITDA was 2.1 times, within our policy range. For financial year '27, we expect underlying EBIT of about $515 to $555 million, subject to the assumptions and risks set out in this presentation.
The transformation program delivered $51 million in net benefits during financial year '26. Commercial actions made the largest contribution.
New customer wins, repricing, and wider use of our premium technology delivered $51 million. Priority growth markets added $19 million.
Changes to how we operate, buy, and manufacture also delivered gains across our cost base. These gains were partially offset by $55 million in temporary headwinds and other impacts.
These included about $40 million from foreign exchange and $11 million in added depreciation. Inflation also had an impact.
Unplanned downtime at Cheyenne and supply limits from the Walgett turnaround accounted for about $16 million. The core drivers of our transformation remain intact: better contracts, firm pricing discipline, stronger manufacturing, and growth in markets where we can win are delivering results.
In financial year '27, we expect another $30 to $70 million in net transformation benefits. Priority growth markets offer the largest opportunity.
New contracts will start in Africa and Latin America, with further growth in Canada, Asia, and WA. We expect a further $20 to $30 million from our commercial actions.
This include commercial customer wins, repricing, better product bundling, and wider use of premium technology. Manufacturing, supply chain, and procurement actions are expected to add up to $15 million.
We will unlock more production capacity through debottlenecking and improved efficiency. About $25 million in offsets will reduce those gains.
These include scheduled maintenance at Moranbah and our foreign exchange assumptions. In this table, you can see our progress since financial year '23.
From financial year '24 to '26, we delivered $185 million in net transformation benefits. Commercial benefits totalled $154 million gross.
Operations added $83 million, and growth markets added $59 million. Against those gains, we had $111 million in offsets: depreciation, stranded costs, inflation, and temporary operating impacts are examples of such offsets.
Underlying explosives EBIT rose from $300 million in financial year '23 to $485 million in financial year '26. We exit financial year '26 with a run rate of $510 million.
That puts us at 70% of our $300 million uplift ambition. By the end of financial year '27, we expect that run rate to reach about 85% to 95%.
We remain on track for the $600 million ambition in financial year '28. This is not the result of any single action; it comes from stronger commercial delivery, lasting changes to our operations, disciplined growth, and a more focused business.
As we showed in our recent Investor Day, we see five powerful megatrends supporting long-term growth across our markets. Electrification and the energy transition are driving critical minerals demand, with copper material moved expected to grow by around 50% from 2021 to 2031.
Supply chain security is also driving investment, with around $30 billion mobilised for critical minerals reshoring in the United States. At the same time, more than $1 trillion of AI-related infrastructure investment is projected over the next 3 to 5 years, supporting demand for commodities, material, and energy.
Declining ore grades, down an estimated 6% to 8%, are increasing the need for productivity, technology, and technical expertise. In defence energetics, the market is expected to double by 2035, creating a compelling adjacent growth opportunity.
Importantly, each of these trends aligns closely with our capabilities and competitive strengths we have, giving us confidence in the long-term outlook for our business. Our growth is gaining traction through customer wins in metals and in the priority regions we shared at our Investor Day.
Metals rose 17% in '26 measured by revenue. The share of explosives revenue grew by 4 percentage points.
In North America, metals revenues rose 29% as we brought in new customers. Canada delivered revenue growth of more than 40%.
New operations including Agnico Eagle's Hope Bay and Skeena's Eskay Creek. In Australia, we won more than 10 new hard rock sites over the past 12 months.
We continue to grow our presence in WA. In Asia, the capital-light model is now operating in Malaysia.
We see further opportunities in PNG, the Philippines, and India. Across Africa and Latin America, we won four new sites, including projects in Ghana, Tanzania, and Brazil.
These wins show that we can achieve when we bring together global customer ties, strong local delivery, and technology that sets us apart. In Africa and Latin America, we are moving from winning contracts to setting up operations and delivering services.
In Ghana, services began in September at AngloGold Ashanti's Obuasi and Iduapriem operations. Local emulsion production in Iduapriem is planned for the first quarter of financial year '27.
In Tanzania, services at Geita are expected to begin as the on-site unit is brought into service this quarter. In Peru, we aim to bring the Ilo emulsion plant into service, also in the first quarter of financial year '27.
In Brazil, operation at Vale's Fábrica site are also expected to begin before the end of calendar year. These leading global customers give us a firm base for growth in these regions.
Our approach is disciplined and makes careful use of capital. Premium technology helps us deliver more value to customers, better quality revenue, and stronger earnings.
Electronic initiation system volumes increased 11% in financial year '26, as customers continue to convert from legacy systems and new customer wins supported further adoption. Our premium products earned margins about 1.2 times those of standard products.
They help customers improve productivity, rock fragmentation, and operating performances. Use of Nobel Fire rose 19%.
Customers are making greater use of digital tools to plan, carry out, and improve their blasting. The aim is not simply to sell more product; it's to deliver more value to customers and build earnings that are stronger and more resilient.
The Autonomous Bench shows technology strategy in action, solving real problems for customers. The solution is designed to automate dipping, priming, loading, and stemming while allowing operations to be supervised from a control room.
This keeps people away from high-risk areas, supports continuous operations, and uses data to deliver more consistent blasting results. The autonomous equipment has now been built.
With our partner, Marampa Mines, we plan the first site trial by mid-2027. This solution is a key part of a fully autonomous mining operation.
Other customers are already showing early interest in the technology. This is a practical demonstration of how our proprietary technology, digital capability, and customer partnerships can create a meaningful competitive advantage.
Energetics opens a new path for growth alongside our core business. Our assets, expertise, and operating systems gives a strong base to compete.
At Graham, Kentucky, two US government-funded projects are building that new growth platform. The TNT project is worth $435 million US dollars.
The IMX project is worth $581 million US dollars. Together, they represent about $1 billion US dollars in government-funded investment at Graham.
The IMX project is being delivered through Nitradine, our 50/50 joint venture with Pelchem, combining Dyno Nobel's manufacturing capability with Pelchem's defence contracting expertise. The value goes beyond a new source of earnings.
The TNT and IMX facilities will strengthen US security of supply, increase vertical integration, and reduce our reliance on imported critical raw materials. The model is designed to deliver recurring earnings through product margins on off-take or tolling fees on government demand.
The TNT project is moving through detailed engineering, permits, and site preparation. First production is expected in late 2028.
First IMX production is expected by 2030. Our financial year '31 group ambition of $800 million EBIT includes about $30 to $40 million from North American energetics.
At Graham, the IMX project takes us into advanced energetics material. The project includes five modular plants, making material such as RDX and HMX.
These can be used on their own or as components of IMX-104. This gives us more ways to serve governments, defence contractors.
It also allows us to supply raw materials for our own commercial use or for sale. In Europe, [Vonges?]
gives us an established base with a long history in energetics and deep technical expertise. European demand for energetics is expected to roughly double between 2026 and 2035.
More manufacturing capacity will be needed. We are exploring a new energetics facility at [Vonges?]
. Off-take talks are moving forward with potential customers in Europe and NATO-aligned customers.
Process and engineering options remain under evaluation, and the next stage will define the preferred concept, development pathway, and commercial approach. We will remain disciplined and progress opportunities where our capabilities create a clear advantage and where the returns justify the investment.
I will now hand over to Nitesh, who will cover the financials. Thank you, Mauro, and good morning, everyone.
In this section, I'll take you through the FY '26 financial performance, investing activities, and the balance sheet. I'll finish with the FY '27 Dyno Nobel outlook.
On slide 22, FY '26 was a strong year for the Dyno Nobel business, and we exit the year on track to deliver the $600 million EBIT ambition in FY '28. We spoke to you about the next horizon of growth to FY '31 and our 800 ambition, but recognise the first step is 600 by FY '28.
Underlying explosives EBIT increased 12% to $485 million, driven by record performances in DNA and DNAP. Our strategic joint ventures also performed strongly.
JV income increased 16% year-on-year to $93 million, and JV tax-adjusted EBIT across the explosives business reached $518 million. I'll talk more about JV tax effect later in the section.
The transformation program delivered $51 million of net benefits in FY '26, taking the exit run rate to 70% of the $300 million uplift ambition. Explosives revenue increased 10%, supported by long-term customer relationships and a forward contract order book of around two times FY '26 revenue.
That forward coverage does not include energetics and provides a strong visibility over the underlying revenue base. Moving to 23.
The business has built strong momentum since FY '23. Underlying EBIT has increased from $300 million to $485 million, representing compound annual growth of around 17%.
ROIC has improved by approximately 90 basis points over the same period, with FY '26 explosives ROIC at 6.7%. Underlying EPS for the explosives business has increased from around 7 cents in FY '23 to 18 cents in FY '26, supported by earnings growth and the share buyback program.
Our forward contract value is an important metric for us. It reflects the trust our customers place in us and the resilience of our earnings through committed contracts.
This stands at approximately two times FY '26 revenue. Together, these indicators show the combination of transformation-led earnings growth, disciplined capital allocation, improving returns, and strong revenue stability.
Moving to slide 24. At a group level, revenue was $3.9 billion, down 26%, reflecting the sale of Phosphate Hill in FY '26 and the IPF distribution business in FY '25.
Explosives revenue was $3.4 billion, which grew 6% year-on-year, with operating margin increasing 3% to just over $1 billion. Group EBITDA, excluding individually material items, was $778 million, and EBIT was $504 million.
Within that result, explosives EBIT increased 17% to $485 million, reflecting the underlying momentum of the transformation program and the impacts of the FY '25 turnaround in the comparator. NPAT, excluding individually material items, was $331 million.
Individually material items were $265 million after tax, mainly relating to the sale of Phosphate Hill, fertiliser exit costs, and the impairment of loans associated with the receivership of QPM, a gas supplier to DNAP. I want to reiterate that through comprehensive security arrangements, gas supply to Moranbah is secure, and we are working with the receiver to maintain a sustainable supply to Moranbah.
After those items, statutory net profit was $66 million, up from a $53 million loss in FY '25. Moving to slide 25.
Now moving on to the underlying explosives business. No adjustments have been made for FY '26 reported ex-IMI numbers.
We have normalised for turnarounds in FY '25, which is why headline EBIT growth was 17%. Underlying explosives EBIT increased 12% to $485 million, with record performances from our two largest business units.
Excluding foreign exchange impacts, explosives revenue increased 14%, and EBIT increased 16%. DNAP revenue increased 11% to $1.3 billion, and EBIT increased 10% to $281 million.
The metals segment was the primary driver of growth, contributing approximately 66% of the total revenue increase, supported by strategic customer wins and successful renewal of key contracts. DNA revenue increased 13% to $1.9 billion, and EBIT increased 19% to $224 million.
FX has impacted the translated results for DNA. In local currency, the performance is better reflected, with revenue growth of 21%, operating margin growth of 8%, and EBIT growth of 28%.
The standout growth was supported by sales of surplus ammonium nitrate during a period of tight supply, the resumption of booster sales following TNT shortages in FY '25, and continued demand across key customer segments. Demand was also higher as several major customers entered periods of increased pre-stripping activities.
The operating margin was impacted by tight AN markets in half two, with higher third-party purchased AN to meet customer demand in the US. DNEL experienced a more challenging trading environment.
Revenue reduced 12% to $287 million. This is mainly driven by the European performance, which was impacted by disruption to key shipping routes arising from the Middle East conflict, which constrained international exports, as well as economic conditions in France and Turkey.
LATAM declined 2% due to severe weather conditions in Chile. DNEL EBIT reduced to $18 million, reflecting the revenue impacts mentioned, together with investments in market entry.
This remains a strategic focus for Dyno Nobel, with new customer mobilisations expected to recover this result. Across the group, transformation initiatives in pricing, procurement, and operations delivered structural cost reductions and efficiency gains.
JV income increased 16%, reflecting strong performance from our North American partners and record earnings from QNP for its financial year ended 30th June. JVs remain a vital part of our strategy, and it's important to note that the post-tax impact to our earnings diminish our EBIT, and has a material impact due to the strategic choice of operations through JVs.
This impact is $33 million in FY '26, due to the growth in this channel since FY '23 and into the future with our defence JV, Nitradine. This needs to be considered for valuation purposes.
We have included a slide in the appendix to illustrate this. On a tax-adjusted basis, total explosives EBIT was $518 million, up 12% from $464 million in FY '25.
Moving to slide 26. FY '26 capital expenditure was $282 million, within our guidance range of $265 to $285 million.
The program included $124 million of sustenance capex, $60 million of digital and technology, and $86 million of capex supporting customer growth. For FY '27, capital expenditure is expected to increase to approximately $370 to $420 million.
The range reflects scheduled turnaround expenditure, customer growth, technology investment, and the next phase of our energetics program. This includes approximately $40 million US dollars for the Cheyenne turnaround and approximately $20 million US dollars for defence and energetics investments.
The FY '27 range also allows for potential customer wins and growth initiatives, with capital continuing to be deployed selectively against expected returns and strategic priorities. These investments are consistent with the capital allocation framework we discussed at our Investor Day in September.
Moving to slide 27. Overall, the balance sheet remains solid, with both ratings agencies acknowledging the improved credit quality post the completion of separation.
We retain investment grade credit ratings of BBB from S&P and Baa2 from Moody's, with both increased leverage headroom to 2.75 times in the year. Trade working capital was 19.2% of revenue, broadly stable against 19.5% in FY '25, while cash conversion at 36% has been impacted by fertiliser separation and higher inventories to manage the volatility in the year.
Going forward, we expect the long-term cash conversion post interest and tax to be in the range of 60% to 75%. Explosives earnings per share, excluding IMIs, increased 56% to 18 cents, reflecting the transformation, non-turnaround year, and the successful buyback program.
This is clearly visible in the explosives ROIC, which improved to 6.7% from 5.2% in the prior year. Net debt was $1.5 billion, and net debt to EBITDA was 2.1 times, within our 1.75 to 2.25 policy range.
On-market buybacks returned $574 million through the program, purchasing 191 million shares at an attractive average price of $3. We have announced a final dividend of 5 cents per share, 50% franked, taking the total FY '26 dividends to 9.6 cents per share.
Now turning to the outlook for FY '27 on slide 28. We currently expect underlying EBIT in the range of approximately $515 to $555 million.
We expect underlying result to be weighted approximately 40% to the first half and 60% to the second half. The outlook assumes borrowing costs of approximately $105 to $120 million, an effective tax rate of approximately 20% to 25%, and capital expenditure, as mentioned, approximately $370 to $420 million.
It also assumes AUD to US dollar exchange rate of 70 cents, corporate costs of approximately $45 to $50 million, and an FY '27 transformation exit run rate of approximately 85% to 95%. In Asia-Pacific, we expect the benefit of higher Moranbah production volumes following debottlenecking, partly offset by the QNP turnaround in the first half.
In North America, the Cheyenne turnaround is scheduled for the second half, with debottlenecking projects at Cheyenne and Louisiana expected to complete during FY '27. In EMEA and Latin America, we expect operations to scale in Ghana, Tanzania, and Brazil.
Net debt to EBITDA is expected to remain at the top end of our guided range of 1.75 to 2.25 times. I'll now hand over to Mauro to close.
Mauro Neves
Thanks, Nitesh. Let me close with a clear message.
These results show why we have confidence in Dyno Nobel's future. We are now a focused, pure-play explosives business.
We have resilient growth, strong contractual protections, and leading positions in attractive markets. Safety and reliability comes first.
They earn our customers' trust, support our performance, and give us the foundation to grow. Long-term demand is working in our favour.
The world needs critical resources, infrastructure, and smarter mining solutions. We are building growth across multiple pathways, which include our established North American and Asia-Pacific businesses, priority markets in Canada, Western Australia, Asia, Africa, and Latin America.
Our strength lies in what we bring together: premium technology, a network of privileged assets, deep customer ties, and experienced people who can deliver. Our transformation is building stronger earnings, better margins, and better ways of working.
At every step, disciplined capital allocation guides our growth decisions. 2026 was a strong year.
We completed our move to a pure-play explosives company and enter financial year '27 with clear momentum. The ambition is clear: $600 million in EBIT by financial year '28.
We remain on track, and we're laying the foundations for the next phase of growth beyond financial year '28. Thank you for your time and your continued interest in Dyno Nobel.
I'll now hand back to the operator. Operator, can you please remind callers how to ask a question in the Q&A?
Operator
Thank you. For those listening by phone and would like to ask a question, please press star followed by one on your telephone keypad to raise your hand and join the queue.
To withdraw your question, simply press star one again. When called upon, please use your handset or headset, ensure your line is unmuted, and be ready to ask your question.
Again, that is star one to raise your hand and join the queue. Your first question is from the line of Ramoun Lazar from Jefferies.
Please go ahead. Oh,
Ramoun Lazar
good morning, Mauro, Nitesh. A couple of questions from me.
Just maybe starting with the '27 guidance. If you'd talk through some of the end markets, some of the moving parts.
I know corporate costs are higher than I think what the Street was expecting, perhaps stranded costs factored in there as well. Then also your first-half, second-half split is more skewed to the second half than normal.
Maybe just talk through that as well, please.
Mauro Neves
Thanks, Ramoun. Good to talk to you.
Look, the second-half, first-half has to do with the turnaround on Cheyenne. Other than that, all the usual weather-related events on the first half remain, we guided to that with and without the turnaround for people's reference.
In terms of end markets, look, we still see strength in our core markets of Australia and in US. If I start with the US, we still see tight markets for ammonium nitrate.
That hasn't changed. We hope that we can see continued growth in that market.
In Australia, we have seen again strength on the domestic markets. The market is very well balanced, probably as balanced as I've seen, and we see still spot trading at when you look at the import parity at around $1,000 landed in Moranbah.
Those are the fundamental base of our forecast for financial year '26 where '27 where we see that $30 to $70 million opportunity to keep growing our earnings year-on-year. I'll let Nitesh answer on corporate costs, and much of that has to do with some sticky stranded costs year-on-year to do with the divestment of fertilisers, but Nitesh will give you a bit more detail on the corporate costs.
Nitesh Naidoo
Thanks, Mauro. Thanks, Ramoun, for the questions.
Just to touch on your first-half, second-half split. As we do have lots of weather impacts in our business, we've used the basis of our long-term average, so that's an estimate from our side at this point in time.
As far as corporate costs, we updated some of the offsets in our '26 results to demonstrate that we had approximately $5 billion impact this year. Next year, we also have the challenge of stranded costs as we've completed the fertiliser separation work.
We are working through the Ignite program, our transformation program, to ensure that some of our operational initiatives work hard to offset that, but largely it's to do with stranded costs.
Ramoun Lazar
Okay. Nitesh, and any other, I guess, temporary factors that you've assumed in your guide for '27 that you expect to impact the result?
Nitesh Naidoo
Yeah. Ramoun, on slide 25, I think the two key ones to note is we've got a little bit of FX working against us, about $5 million.
We had an average of 69 cents this year, and next year we're planning for 70. We've also called out that included in our FY '27 transformation offsets $10 million related to a scheduled maintenance at Moranbah.
That is separate to the turnarounds that we've called out specifically that impact our underlying results. That scheduled maintenance of $10 million in Moranbah, we've not taken it to underlying; we've just assumed that that is part for the course of operations.
It's scheduled, and it's not an abnormal factor that we would experience every year, so that's two offsets to our program this year.
Ramoun Lazar
Got it. While I've got you, maybe just on your leverage guide as well, that's also expected to come in at the top end of your range.
Maybe just if you can talk through some of those factors, I guess what's driving that high capex number relative to expectations, and do your assumptions also make any allowance for contribution from Perdaman and the Geelong proceeds?
Nitesh Naidoo
Thanks, Ramoun. I think the main difference in terms of leverage being at a higher level is to do with fert separation.
One major cash outflow in FY '27 is the ARO payment that we expect to make in FY '27. The timing of that is obviously relevant versus some of the other proceeds that we expect from the fert separation.
It's really the timing of some of the payments we're making in fert separation: one on the ARO for Phosphate Hill, and second, some of the remediation work that we're doing in GI and Geelong. The timing of the expenses versus some of the proceeds that we're getting from the fert separation is driving that temporary heightened level of leverage.
We also need to note that this is a turnaround year for Cheyenne, and some of our energetics expenses are also proving to increase our capital expenditure and that leverage.
Ramoun Lazar
Good. I'll leave it there.
Thanks.
Nitesh Naidoo
Thanks, Ramoun.
Operator
Your next question is from the line of Mark Wilson of RBC. Your line is open.
Mark Wilson
Thanks very much, Mauro and Nitesh. Just interested in some of the new contract wins that you've actually spoken to, just sort of wondering if you could elaborate upon those and how material they are likely to be as we progress.
I also had a question about contract value being double that of fiscal '26. What does that actually mean, and how are you quantifying that?
Thanks very much.
Mauro Neves
Good morning, Mark, and thanks for the question. Look, the the contract wins are really exciting because they play to many of our of our strategic directions: one being, tying up with customers that already have business with us in other parts of the world.
Case in point, AGA, who is a traditional customer of ours in Western Australia, and also Vale, who has been doing business with us in Canada for some years and now giving us the opportunity to serve them in Brazil. It's all predicated on our Delta E differential energy technology with electronic detonators, proves the point of, we win when we generate additional value through technology to our customers.
Those are the the site in Brazil is smallish. The sites in Africa are very large and and provide us a good opportunity for for earnings growth.
They they set us set operations in countries that have traditional mining operations, especially in Brazil, Ghana, and Tanzania, I would expect that once you have set up shop and established an operation, that would create pathways for for further growth from there. In terms of in terms of the the the overall Can can you ask again the second question?
Sorry, I lost my my train of thought.
Mark Wilson
Yeah. No, that's okay.
No, just in relation to contract value, you've sort of put in there that fiscal '27 it's double that of fiscal '26. Just trying to understand how you are quantifying that, what does it all mean, and I'll add another one there: where was that figure 12 months ago and 2 years ago?
Mauro Neves
This is something that we disclosed for the first time in our recent Investor Day, Mark. This is the size of our forward contract book.
The way we measure that is, what is the revenue that we have contracted, if you look the full business forward, divided by the revenues of our previous financial year? Essentially gives you a sense of the amount of forward revenue that's pre-contracted the business.
Obviously, it varies from market to market, varies from customer to customer, you have contracts ranging from 5 years in your metals mining customers typically to more like 1-year renewals in your quarry and construction US, and you have everything in between. With the 2 years, we try to give you a sense of the quality of our forward contract book.
This is a new statistics that we provided for the first time in Investor Day, and that's something that we expect to keep informing the market as we're moving forward, to keep a track of the quality of our ongoing contract book.
Mark Wilson
Thanks very much, Mauro.
Operator
Your next question is from the line of Jakob Cakarnis of Jardens Australia. Please go ahead.
Jakob Cakarnis
Hi, Mauro. Hi, Nitesh.
I just wanted to pick up just on Mark's question there on slide 23, just on that forward contract value. Can you break down maybe for us how much is price and mix versus volume just contributing to that, please?
Nitesh Naidoo
Maybe I'll take this one, Jakob. It's combination of both, but the intention of this is less on the proportion of price and volume, more so the fact that this is the contract value that we have in commitments from our customers that is not reflected in our past earnings.
This will come through as revenues, as contracted revenues, into the future. It's a combination of one, the commitment in the contract, and the volume and price that we've already signed with those committed contracts.
It's bringing back Mauro's point around the quality of the investment proposition here at Dyno, because we have a high quality of earnings, which is the contracted commitment that we have from our customers.
Jakob Cakarnis
Thanks, Nitesh. That was worth a shot.
Just on the cash conversion. Obviously there's some temporary issues in there, particularly around inventory builds and the like, and you've given us a sense of what it should look like next year.
When do we get to steady state on the working capital side of things, and then cash conversion? Is that now from FY '27, and that's kind of the right 60% to 75% to think about moving forward, please?
Nitesh Naidoo
Yes, and that's the intention. I know we've had lots of feedback from analysts and investors around the volatility around cash conversion, going forward this year, we don't utilise working capital facilities, which had an impact on cash conversion historically as we had the fertilisers business.
Going forward, we have a far more stable perspective on cash conversion, and it's consistent with the guidance I've provided, which is in the 60% to 75% range from FY '27 onwards.
Jakob Cakarnis
Okay. Then just the difference, Mauro, just in the growth assumed in the guidance range, it doubles the EBIT growth year-on-year between the low end and the high end.
I think Ramoun kind of hinted on this, but what are the key moving parts for the differences in the assumed growth? Is it a matter of the turnarounds falling in that $25 million expectation, or are there other items outside of that, please?
Mauro Neves
No, look, it's just we're getting used to the idea of having earnings guidance, and we want to provide for a budget that has different levels of risk on the implementation. Those that we're calling out that are starting now, they're all in the base, they are the contract wins that are already booked, and you should expect them to be cash flowing now in the first quarter of financial year.
They are in the other extreme, on the high end, you have those where we have started commercial activity, the teams are confident, but again, you have a range of confidence levels. As we do a budget, we try to have a centre point where we look at those things that have decent likelihood, and then obviously we allow for risks to the upside and downside.
There's nothing other than the natural success factor of our tender processes.
Jakob Cakarnis
Okay. Thanks, guys.
I'll hand it over. Thank you.
Operator
Your next question is from the line of Lee Power of J.P. Morgan.
Your line is open.
Lee Power
Hi, Mauro and Nitesh. Just following on from Ramom's question around the 2H skew in the outlook, I get what you're saying and it seems like your story is pretty consistent, and you got the contract book commentary there.
What are your customers actually telling you about the backdrop post the midterms, particularly in the US?
Mauro Neves
Thanks. A great question, Lee.
Look, it's probably too recent to tell, but we haven't seen any sign of change on the megatrends or any indication that the fundamentals that were driving them would change, whether it's in the defence energetics, whether it's in the AI investments. All indications, even pre the elections, suggested those things were, in a way, bipartisan, and you wouldn't see those fundamental changes about reshoring critical minerals or re-establishing sovereign capacity in ammunition.
We don't see those things fundamentally change by either side of the aisle. Obviously, we'll keep an eye on that and report back as we see the progress.
Far, our bigger customers, many of which were represented on Investor Day, remain quite positive about the long-term outlook.
Lee Power
That's useful. Thank you.
Then just on the [Vonges?] , the energetics side, are there any differences in off-take contracting in Europe versus the US?
I'm thinking about things like are they take-or-pay commitments? How do you think about the certainty of an off-take in Europe versus what you have in the US?
Mauro Neves
It's a great question, Lee. Typically it will be a different model from the US.
The US model is what we call the GOCO where the government has invested in the facility, and they naturally take all the needs. They desire for their own capacity, whilst in the Europe market where first you have multiple countries relying on capacity and they tend to not have the same scale as the US comparatively, what typically happens is we would make the investment and then we would rely on off-take arrangements typically with the primes, the people that will be dealing with the different governments on their ammunition plans.
You would expect us to in time come with a number of off-take agreements with prime companies in Europe that would underline our investment in [Vonges?] .
Yes, it's difficult to say exactly the nature of that off-take, if they will take the form of some joint venture arrangements, some partnership, some take-or-pay as you described. It's early to tell, but yes, it will be through the primes in Europe.
Lee Power
Okay. Thank you.
Appreciate the colour.
Operator
Your next question comes from Harry Saunders of E&P. Please go ahead.
Harry Saunders
Good morning. Thanks for taking my questions.
Firstly, just wondering with the weaker DNEL result, can you talk through your expectations for the business baked into the FY '27 guidance and contribution maybe to the $600 million target now, please?
Mauro Neves
Thanks, Harry. Look, '20, I'll start by saying '26 has been a disappointing year on DNEL, and we were very direct that we would expect for '26 a bigger contribution coming from the asset.
There's probably three things that, as Nitesh pointed in his presentation, underlined why we had somewhat disappointing results: the weakness on the French and Turkish infrastructure domestic market, much like the story of other European countries that saw infrastructure investment declining. We also had some difficulties exporting products out of [Vonges?]
into other markets in Europe, much driven by shortage of shipping given the Strait of Hormuz crisis. We would hope that those things reverse throughout this year, and we have a more normal base European business.
Other than that, really the growth that I outlined, whether it's from the new built Ilo plant in Peru, the startup of Geita, Obuasi, and Iduapriem in Africa, and the business in Brazil growing now with the first announced contract with Fábrica. All those things give us confidence that financial year '27 should be a better year for DNEL, but we accept that the financial year '26 results were not what we expected.
Harry Saunders
Can you give us any more into, would we get back up to, say, '25 levels there, or too early to tell?
Mauro Neves
We don't guide, Harry, by end market, but you should expect us to be reversing the reduction from this year.
Harry Saunders
Thank you. Just wondering on capex, how we should perhaps think about more normalised capex in '28 when delivering that $600 million targeted EBIT?
Are we just pulling out the 40 million of turnaround capex this year or other things to consider there? Thanks.
Nitesh Naidoo
Thanks, Harry. I think when you look at some of the material we shared at our Investor Day, we would see capex intensity reducing over the next 5 years.
I think next year, kind of pulling back the turnaround spend for Cheyenne is key. We show a turnaround schedule in our appendix for some major and minor turnarounds, so that'll help you on some of the longer-term outlooks as far as turnarounds are concerned.
Generally, on the slide, we show that capex intensity from a capex-to-revenue basis was around 8%, and we would expect that to decline in the coming years.
Harry Saunders
Thank you. Final question, just if you could talk about how the supply-demand and AN pricing backdrop in the two main geographies panned out over the last 6 months, how it's currently tracking, when you expect that North American tightness to persist until, and does the guidance anticipate sort of a headwind comping the one-off spot sales in '26 or are you sort of expecting a similar benefit?
Thanks.
Mauro Neves
No, as I described earlier, Harry, we expect the ammonium nitrate market to remain very balanced, we don't see the trends that we described earlier in the half year results reversing to financial year '27. The plant that was down in the US is still not back, and to my best knowledge, there's no plan to bring it back in the short term.
Obviously, the market finds new sources, and there has been a number of imports into the US, which is not usual. In the Australian market, there hasn't been any change, you're still seeing import parity at Australian ports at around $900, $950 per tonne, and then landed in Moranbah at about $1,050.
Look, that's the premise of our planning, really no major change from financial year '26, which it was a strong year. Just as we grow in the US, we need to understand that some of the volumes that we're serving in the US is on trading, we will have the tailwind of prices as we recontract new customers into the US, but we only take the short-term opportunity for any spot tonnes we have available.
Obviously, that will be a consideration as we move forward. For traded tonnes, we are a price taker, and obviously we don't have as much opportunity in that space, different from when we are trading our produced tonnes out of Cheyenne and Louisiana.
Harry Saunders
Got it. Thank you.
Operator
Your next question is from the line of Brook Campbell-Crawford of Barrenjoey. Please go ahead.
Brook Campbell-Crawford
Good morning. Thanks for taking my question.
I just had one on the $25 million estimated turnaround impact. Just want to check if that's a fairly locked-in number that wouldn't have much variance around it, maybe tell me a couple of mil, or if this is something that you've needed to make some estimates around AN pricing and ammonia, and the variance could be $5 to $10 million or if it's all around that $25 million estimate?
That would be great. Thanks.
Mauro Neves
Thanks, Brook. Look, it's not the first time we are forecasting turnaround, I think we have some decent level of understanding of what that looks like.
I would say we have a good handle on that number, and that's essentially the Cheyenne plus the impacts of the QNP turnaround that is also happening this year, as Nitesh said in his presentation. QNP and those non-sole JVs we have is an important part of our earnings, every time that one of those JVs have a one-off, it has an impact on our numbers.
We have a good handle of those, and I don't expect that to be varying much outside this 25 million that we guided.
Brook Campbell-Crawford
That's great. Thanks.
Just on market share, you guys seem to be winning more contracts than you're losing, and there's lots of good anecdotes you've provided today and at your Investor Day. Is there a way you can sort of simplify it for us, maybe like a market share number that you would estimate you have at the moment, and maybe comparing that to a couple of years ago, perhaps before some of these gains started to flow through?
Any colour on that would be helpful. Thanks.
Mauro Neves
Thanks, Brook. As we disclose more, obviously there's an appetite for more and more information.
We do our best to give you a sense and give you data where it's relevant. I would say that especially on the growth markets, that's where I would put your attention.
We told, for instance, that we have increased our metals revenue in Canada by about 40%. Some of that comes out of new operations, greenfields, brownfields, but also having won some contracts from our competitors.
Those are areas where there is a material move in market share. Equally, those mines that we taking up, whether it's in Brazil, whether it's in Africa, and our entry in Ilo in Peru, all the revenues coming out of those are new revenue that was being served by some competitor.
Those are the areas to note and probably the areas where you should put your attention. In the mature markets, we have been very disciplined in price.
We win on the basis of value creation, we win some, we lose some, and we have seen some growth year-on-year, but fair to say not as marked as the markets that we highlighted in our presentation.
Brook Campbell-Crawford
That's great. Maybe just one last quick one.
Indonesia was a softer market in FY '26, and that was on a huge market for you, but it was sort of one of the kind of weak points globally I think for all players. What's your assessment at the moment?
Have conditions sort of recently picked up, and outlook looking better, or do you think it's still going to remain pretty challenging in Indonesia for the year ahead? Thanks.
Mauro Neves
Look, Stuart was there last week, and we have been investing in the country, including some emulsion manufacturing with a partner. Our view of the market is it's firming up.
I won't comment on the strength of the currency; obviously, that has been a big factor for this past year, it's really difficult to forecast what will happen. Those recent situations where they have done some export bans, and which impacted the market to some extent, we've seen those things tempering down, and we expect a more normal year out of Indonesia.
Brook Campbell-Crawford
Thank you.
Operator
Your next question is from the line of Niraj Shah of Goldman Sachs. Please go ahead.
Niraj Shah
Morning, Mauro and Nitesh. I might come at the DNEL questions a different way.
You've called out $35 to $50 million in priority growth markets, in terms of the contribution to FY '27 transformation. I guess how much of that should go to DNEL versus, say, Canada, for example?
How much of that is underpinned by contracts you've already signed?
Mauro Neves
Again, you're asking the same question in a different way. Appreciate that, but we haven't guided by end market.
Giving earnings guidance for us was a big step, Niraj. I think we'll probably stick to group-level earnings guidance.
To your second question, think about the 35 million, the bottom of the range, being the run rate of financial year '26 plus the ones that we have disclosed that are in the process of starting operations, what we'd call low-risk growth. We're pretty confident on those.
The top side of the range are activities, commercial activities that are underway with various degrees of probability. We try to give you a range of success, and typically what we do is we put the low-risk growth opportunities in the bottom end and the more high-risk opportunities in the top range.
Niraj Shah
Yep, fair enough. Just another quick one from me, on DNA.
It looks like Q&C and metals held pretty solid momentum in the second half, but I could be wrong, but coal seems to have slowed a bit. I was just wondering if you could comment on that and how you're seeing that coal end market in the US in particular into FY '27?
Mauro Neves
I think your comparison is right. The way you're portraying that metals and quarry and construction have been strong year-on-year, half-on-half, not as strong as coal, which is not surprising.
We saw coal having a bit of a comeback in the first half, and we described some of that had to do with pre-stripping activity that people do in advance of resuming mining operations. We saw that now more tempered half-on-half.
Year-on-year, it was a 10% growth for coal, which again is a change on a declining year-on-year trend that we've seen for a few years. I agree with you that compared to quarry and construction and metals, not as impressive growth as we saw in those other two markets, which is not necessarily a bad thing.
As Niraj, comparatively quarry and construction and metals are our best mix, give us the best yield, the best margins per tonne. We don't mind when the mix moves into more quarry and construction and metals.
Niraj Shah
Yep, makes sense. Then final one from me.
From memory, Kentucky TNT was still pending definitisation before construction could commence. I guess, in addition to the pre-engineering work, what sort of milestones need to be hit before you actually start construction on that TNT facility?
Mauro Neves
No, I'm happy to confirm that definitisation is now complete, and we are starting construction early next calendar year. It's all systems go in that space, Niraj.
Niraj Shah
Great. Thank you.
Operator
A reminder, before we move on to the next question, if you would like to join the queue, press star one. Your next question is from the line of Scott Ryall of Rimor Equity Research.
Please go ahead.
Scott Ryall
Hi, thank you very much. Hey, Nitesh, I'm just giving you a heads-up, my second question's going to be on note 17 from your accounts, just so you can get that up.
The first one is to Mauro. Mauro, you've set out the industry megatrends for the business.
You've set out your investment priorities for the next year or two, and you've stressed the investment discipline. If I look at slide 25, which is where you've got the summary of the splits between the different geographic divisions, I was wondering if you could look out a little bit further on a kind of 3-to-5-year basis and just talk us through the investment decision-making that you're thinking about now just in terms of where the more attractive geographic markets are for you to invest for the longer term, please?
Mauro Neves
Thanks, Scott. Let me start answering your question in a different way.
Let me tell you what we're not investing in. We're not investing in low returns, heavy infrastructure business like ammonium nitrate in the next 3 to 5 years.
We believe the market long term is well balanced, and we need to return better returns on our existing infrastructure and play on capital-light growth opportunities, especially on markets where ammonium nitrate is naturally traded. In case in point, I made all this preamble to talk about things like Ilo in Peru.
This is a growing market for mining globally. I have been there just a few months ago to cut the ribbon on our new emulsion plant.
When you think about a new ammonium nitrate plant, you're talking about probably $1.2, $1.3 billion if you were to bring new capacity of the scale that we have, whilst a new emulsion plant is about tens of millions of dollars, and as everyone else, you are importing ammonium nitrate in the country. You really competing on the basis of technology, on the quality of emulsion, on the quality of technology, and not necessarily on having the molecule of AN, which in our view is abundant globally and can be traded in these new growth markets.
Now, if I look at things like energetics and technology, that's probably the two areas that we are seeing potential opportunity. Starting with energetics, as I described in my presentation, we see Europe energetics doubling in the next 5 years, and there is a window opportunity to fulfil that necessary growth that we'll see in the manufacturing capacity.
Obviously, we'll do that in disciplined ways. As I got a question just a few minutes ago, we won't be doing that unless we have some security of supply and some understanding of off-take from people that are interested in the plant, and we'll have more to say about that in the next few months.
Now, in terms of technology, the thing that makes me most proud is when we make investments over the years and it pays back like what happened with the Autonomous Bench. We this year launched industry-first ability to make autonomy a reality in the last moving part on the mining segment, which is the ability to do everything we do in a bench without any people involved.
That investment's now a reality, starting to be tested next year in Marampa Mines, and with lots of interest of the big miners globally. To be honest, we have more demand than we can probably deal with in the short term.
We really now coming back to the drawing boards to think about how we can accelerate implementation of what has been a very successful launch. Think about technology, think about low capital emulsion plants in growing markets, think about how we invest in energetics, those are probably the main drivers of our growth beyond the sustaining growth of our existing operations.
Scott Ryall
Okay. It's not any particular geography that you're seeing as attractive; it's more the end market and where you see the opportunities for those end markets you've just described.
Is that a fair way of thinking about it?
Mauro Neves
Think about following our customers and following growth. For instance, I don't want to discriminate against our mature markets, because as much as they are mature, there's lots of growth in Asia-Pacific and Americas.
In case in point, places like Malaysia where we've grown from nothing to a somewhat meaningful presence in quarry and construction, or Canada that grown year-on-year 40% in metals. Even the mature markets have lots of opportunity to continued growth.
Fair to say that on a very low base, LatAm and Africa remain the biggest relative opportunities for us. We are not shy to put down capital on, and again, on the basis of tens of millions of dollars of emulsion plants in places like Peru, in places like Brazil, in places like Ghana and Tanzania.
Those are likely to be disproportionately important given what's happening on the mining activity on those markets. Notwithstanding those growth markets, our more mature markets are not shy of opportunity in places like Canada and WA.
Scott Ryall
That's a really helpful answer. Thank you.
Nitesh, hopefully you've got the provisions note up. Just I'm looking at the footnote number one just on the Phosphate Hill sale agreement.
I just ask for some confirmation as to the provisions and potential ongoing liability. Have you now ruled this off?
This payment that you've made, the 125 million of funding support for future rehabilitation and remediation, does that rule off Dyno's exposure to Phosphate Hill, please?
Nitesh Naidoo
That obligation following the payment of that asset retirement obligation passes to MEPA.
Scott Ryall
Great. No kind of potential residual liability or anything like that as far as you're concerned?
Nitesh Naidoo
I think when we concluded the sale, our assessment is that that concludes our residual liability.
Scott Ryall
Okay. Excellent.
Thank you. That was all I had on that one.
Thanks very much.
Operator
Your next question comes from the line of Ben Wedd of Macquarie. Please go ahead.
Ben Wedd
Hi, both. Thanks for the time.
Just a couple of quick ones from me. Just on the DNAP business, any observations on Indonesian coal demand going to FY '27?
I know you've detailed how it was a pretty soft market in FY '26.
Mauro Neves
Hey, Ben. As I mentioned before, we expect the '27 situation to be normalised, volume-wise, we expect the financial year '27 to be a normal year for us.
As I said, difficult to comment on the translation impacts on Aussie dollars, but in terms of volume and price, we don't see any change year-on-year.
Ben Wedd
Great. Thanks, Mauro.
Then also just thinking about the contract or recontracting cycle here, what are your sort of expectations for pricing, predominantly speaking in the DNAP business, into next year, and maybe you can frame that in terms of what percent of the contract book is up for renewal, if that's possible?
Mauro Neves
Thanks, Ben. Consistent to what I discussed before, we're not up for renewal next financial year, and that's part of the 2 years contract life that we mentioned earlier today.
The DNAP sustaining price stays very healthy at about $1,000 landed in Moranbah in terms of import parity. I would say that if the conditions remain unchanged, I would expect that the next recontracting cycle would give us another opportunity to play catch-up and to have another bite of the cherry, probably not as substantial as the last one where there was a correction, but it's still opportunity to get nearer that current spot price level.
Ben Wedd
Thanks very much. Appreciate the time.
Operator
That concludes our Q&A session for today. I would like to turn the call back over to Mauro for closing remarks.
Mauro Neves
Thanks for your interest. I look forward to meeting many of you the next 2 weeks as we go in our roadshow.
Couldn't be prouder of the year we've just finished. It was our first year giving earnings guidance to the market, coming to full year being able to report being squarely within the guidance, having just come out of Investor Day showing the capability of our team.
If I could just drop a last line here to thank everyone in Dyno Nobel for their efforts, a team that wouldn't be possible with each of you. Now I'm speaking to the 25% of our workforce that has chosen to be with you, investors, part of the investors of our company.
My big thanks for the Dyno Nobel team and their efforts to bring together these results, and we are already in delivery mode for the next year. Thank you, everyone, and see you in the road.