Helios Towers Plc
Q3 FY2026 · Earnings Call TranscriptNovember 5, 2026
Tom Greenwood
Good morning, everyone, and welcome to Helios Towers Q3 2026 earnings presentation. Thank you for joining us today, and I hope you and your families are doing really well.
I'm very pleased to report another strong quarter for Helios Towers with record customer demand, continued double-digit earnings growth, and strong progress on our Impact 2030 strategy. We're seeing accelerating investment from our customers across our markets, and our world-class operating platform is enabling us to deliver on all opportunities while increasing returns and shareholder distributions.
We're firmly in the cash compounding sweet spot. With our return on invested capital expanding further above our weighted average cost of capital, we're continuing to deploy capital in accretive growth and, at the same time, return excess capital to shareholders.
As we'll go through today, the outlook—short, medium, and long-term—is strong for continuing this growth and returns cash compounding value creation cycle. Joining me today are Manjit Dhillon, our CFO, and Chris Baker-Sams, our head of investor relations.
I'll start by covering the key highlights, our structural growth opportunity, and our outlook for 2027. Manjit will then take you through the financial results in more detail before we open up for questions.
Before turning to the results, I want to briefly highlight our investment thesis, which is built around four key pillars and further reinforced by our Q3 performance. First, a multi-decade growth runway with a 15-year total addressable market of roughly double our platform today.
We operate in some of the fastest-growing mobile markets globally, supported by powerful demographic trends, increasing mobile penetration, and accelerating data consumption. Second, a world-class operating platform.
Over the past 16 years, we've built an exceptional operating business with market-leading positions, outstanding customer relationships, and a relentless focus on customer experience excellence. Third, a robust and resilient business model.
Our long-term contracts, high-quality customers, and contractual protections provide highly predictable revenues and cash flows, while our colocation model delivers significant operating leverage as we grow. Fourth, disciplined and flexible capital allocation.
Our established platform enables us to invest in highly attractive organic growth opportunities while simultaneously improving returns on invested capital, strengthening our balance sheet, and increasing shareholder distributions. These four pillars reinforce one another and underpin our confidence in delivering sustainable compounding value growth for shareholders over the coming years.
Turning to today's agenda, I'll begin with the operational and strategic highlights, including the accelerating demand we're seeing from customers and our expectations for 2027. Manjit will then cover the financial performance before we move into Q&A.
Let's start with the highlights. We've delivered another exceptional quarter, and I think these results demonstrate something particularly important about where Helios Towers is today.
We've entered a very exciting phase in our evolution, where we're delivering record organic growth, improving returns on capital, and accelerating shareholder distributions, all at the same time. That's precisely what we mean when we say we're firmly in the cash compounding sweet spot.
There are four key highlights. First, record customer demand.
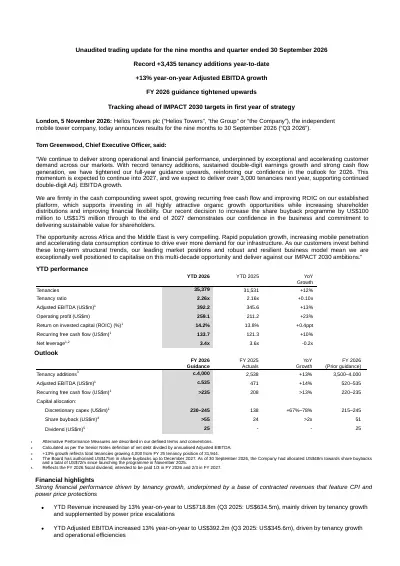
We've added over 3,400 tenancies year-to-date, including 942 new sites. That's already significantly ahead of the 2,500 tenancies we added throughout the whole of 2025.
Importantly, we're seeing customer investment accelerate across our markets with a strong pipeline of new business developing. Our tenancy ratio has also increased by 0.1 year-on-year to 2.3 tenants per site, demonstrating the increasing utilization of our existing infrastructure.
Second, strong financial performance directly linked to tenancy growth. EBITDA increased 13% year-on-year, while recurring free cash flow increased 10% to $134 million.
Critically, our return on invested capital increased by 40 basis points to 14.2%. This is the power of our business model.
As we add more tenancies to our established infrastructure, we generate highly attractive incremental returns, driving earnings growth, expanding cash flows, and improving capital efficiency. Third, accelerating shareholder returns.
We've repurchased $48 million worth of shares year-to-date, bringing total buybacks to $72 million since launching the program last November. In September, we increased our share buyback authorization by a further $100 million to $175 million, extending the program through to the end of 2027.
We also paid our inaugural interim dividend, marking another significant milestone for Helios Towers. Fourth, we've tightened our full-year guidance upwards.
We now expect around 4,000 tenancy additions this year, around $535 million of EBITDA, and more than $235 million of recurring free cash flow. We're also increasing expected shareholder distributions attributable to this year to more than $80 million.
All of this is underpinned by a highly resilient business model with a record $6.2 billion worth of future contracted revenues from high-quality multinational mobile operators. The really important takeaway is that our growth is accelerating at precisely the same time as our cash generation and returns on capital are improving.
This gives us the ability to continue investing in highly attractive organic growth opportunities, all while strengthening our balance sheet and returning increasing amounts of capital to shareholders. It's a very powerful combination, and one that we expect to continue compounding over the years ahead.
This slide demonstrates the exceptional resilience and consistency of our business. Over the past decade, we've grown EBITDA at a compound annual growth rate of 23%.
Importantly, we've delivered uninterrupted annual EBITDA growth throughout this period. Just consider the external events we've navigated: Brexit, oil price shocks, US-China trade tensions, COVID, global inflation, rising interest rates, US tariffs, and more recently, geopolitical conflict.
Throughout all of this volatility, our business has continued to grow. That's because our growth is fundamentally driven by long-term structural demand for mobile connectivity, rather than short-term economic cycles.
Our relentless focus on customer experience excellence means we have the operational resilience to translate this structural growth into business growth. Our customers continue investing in their networks because mobile connectivity is essential infrastructure and must be there to meet the demand growth in subscribers and data.
Our contractual protections, operating model, and focus on business excellence provide resilience against external volatility. We're now guiding to around $535 million of EBITDA for 2026, almost 10 times our level in 2015.
This track record gives us tremendous confidence in our ability to continue compounding earnings and cash flows over the years ahead. Turning to the outlook for our markets, this is an exceptionally compelling chart.
We're seeing a fundamental divergence in mobile operator investment trends between Africa and the rest of the world. According to current consensus forecasts, mobile operator capex in Africa is expected to increase by around 50% between 2025 and 2029.
Compare that with just 4% in the US, declines of 14% in Europe, 9% in Asia, and 7% in Latin America. While mobile operator investment across much of the developed world is expected to remain broadly flat or declining, investment in Africa is forecast to increase very significantly.
Importantly, we're already seeing this acceleration happening on the ground. Our customers are investing more in network coverage, capacity expansion, and technology upgrades.
This is translating directly into the record tenancy demand and the expanding pipeline we're experiencing across our markets. The underlying drivers are structural.
Africa's population is growing rapidly, mobile penetration remains relatively low but is growing fast, and data consumption is accelerating as more people access increasingly digital mobile services. The key point for Helios Towers is that we're exceptionally well-positioned to deliver on this investment.
We have leading market positions, long-established customer relationships, and a world-class operating platform across the nine markets. Because our infrastructure is already in place, much of this additional demand can be accommodated through highly attractive, capital-efficient colocation growth.
This creates the opportunity for sustained, strong earnings growth with improving returns on capital and accelerating cash generation. When we look at the longer-term structural trends, the opportunity becomes even more compelling.
Let's now look at our longer-term total addressable market. This slide really demonstrates the scale of the opportunity ahead.
We're operating in a region experiencing some of the most powerful demographic and digital growth trends anywhere in the world. Between 2025 and 2040, the population across Africa and the Middle East is expected to increase by around 600 million people, or 33%.
It's an exceptionally young population, with around 65% under the age of 30. Alongside this, we expect around 800 million additional unique mobile subscribers, with mobile internet penetration across our markets increasing by around 15%.
Across our markets, mobile data consumption is forecast to increase by 12-fold by 2040. When you consider how integral mobile connectivity has become to everyday life, it's easy to understand why.
Mobile networks support everything from basic communication and social media to banking, payments, commerce, healthcare, and education. Increasingly, artificial intelligence and other data-intensive applications will drive even greater demand for network capacity.
In many of our markets, mobile networks are the primary means of accessing the internet and participating in the digital economy. It's fundamental to the economic and social development of the countries in which we operate.
What does this mean for Helios Towers? The analysis indicates around 72,000 additional addressable tenancies across our nine markets by 2040.
To put that in perspective, that's roughly twice the size of our entire tenancy portfolio today. This is just within our existing markets.
We don't need to enter new countries or pursue acquisitions to access this opportunity. We already have the infrastructure, customer relationships, and operational capabilities to deliver a significant share of this growth.
While we're seeing exceptional customer demand today, the bigger message is that we have a multi-decade runway of organic growth ahead of us. Our Impact 2030 strategy is designed to convert this structural growth opportunity into sustained earnings growth, increasing cash flows, and attractive shareholder returns.
Turning to Impact 2030 and how we're allocating capital to maximize long-term shareholder value. Our strategy targets more than $1.3 billion worth of cumulative recurring free cash flow between 2026 and 2030.
Our capital allocation framework has three clear priorities. First, optimize organic investment.
We expect to invest more than $500 million in attractive organic growth opportunities through 2030. Our established platform and colocation business model enable us to generate exceptional incremental returns.
Historically, our growth capital expenditure has delivered incremental returns on invested capital of more than 30%. These investments underpin our ambition to deliver more than 9% annual EBITDA growth through 2030.
Second, maintaining a strong balance sheet. We remain committed to disciplined leverage management, targeting a range of 2.5 to 3.5 times.
As earnings and cash flows continue to grow, we expect further deleveraging and increasing financial flexibility. Third, attractive and growing shareholder distributions.
Our Impact 2030 strategy targets more than $400 million of cumulative shareholder distributions through 2030, combining share buybacks and a growing dividend. We're already demonstrating our commitment to this.
Our recent decision to increase our share buyback program to $175 million through to the end of 2027 reflects our confidence in the outlook and our commitment to shareholder value creation. The important point is that these priorities are complementary rather than competing.
Our business is generating sufficient cash flow to invest in attractive organic growth opportunities, strengthen the balance sheet, and increase shareholder distributions simultaneously. As recurring cash flow compounds, too does our flexibility to allocate capital in the most value-accretive way.
Turning to our initial expectations for 2027, the message here is very clear: the exceptional momentum we're delivering in 2026 is expected to continue into 2027 with another year of strong organic growth, double-digit earnings growth, further deleveraging, and accelerating shareholder returns. Importantly, this outlook is supported by the strong pipeline we're already seeing develop across our markets.
Starting with tenancy growth, following around 4,000 tenancy additions this year, we already anticipate more than 3,000 additional tenancies in 2027. That represents another very strong year of organic growth supported by sustained investment from our customers.
Given the structural trends we've just discussed, we see significant opportunities to maintain attractive organic growth well beyond next year. Second, EBITDA.
Following around 14% growth expected in 2026, we're already anticipating another year of double-digit EBITDA growth in 2027. This reflects the operational leverage inherent in our business model, where incremental tenancies drive attractive earnings growth and returns on capital.
Third, continued deleveraging. As earnings and cash flows continue to expand, we expect net leverage to reduce further.
This will strengthen our balance sheet and provide increasing financial flexibility. Fourth, accelerating shareholder returns.
We're targeting completion of our $175 million cumulative share buyback program by the end of 2027, alongside a 10% growth in our dividend. We're delivering across every element of our capital allocation framework: investing in attractive organic growth opportunities, strengthening our balance sheet, and increasing shareholder distributions.
Critically, we're doing all three simultaneously. This is what makes the next phase of Helios Towers' growth particularly exciting.
We've spent the past 16 years building a world-class operating platform across some of the fastest-growing mobile markets globally. We're now seeing accelerating demand for that infrastructure at a time when our established platform enables us to deliver this growth with highly attractive incremental returns.
The result is a business with a multi-decade growth runway, sustained double-digit earnings growth potential, and increasingly powerful cash generation. As that cash generation compounds, too does our ability to invest for future growth and return capital to shareholders.
We're entering 2027 with real momentum, and we're very confident in our ability to continue delivering on our Impact 2030 ambitions. With that, I'll hand over to Manjit to take you through the financial performance in more detail.
Manjit Dhillon
Thanks, Tom, and hello, everyone. I'll now take you through the financial results in more detail for what has been another strong quarter, building on the momentum we saw in Q1 and Q2.
To jump into the Q3 results and moving onto slide 13, where we set out our tenancy metrics. The graph on the left-hand side shows the growth we've achieved in our total sites, increasing by 7% year-on-year to 15,688.
That represents 1,067 additional sites over the past year, including 942 added year-to-date. We've continued to add tenancies at a record rate, increasing total tenancies by 12% year-on-year to 35,379, an increase of 3,848 tenancies year-on-year, including 3,435 year-to-date.
DRC, Tanzania, and Oman continue to show strong growth, along with a significant increase in Malawi. These increases in sites and tenancies have seen our tenancy ratio increase to 2.3, with South Africa delivering the fastest pace of lease-up and continued rises in Tanzania, DRC, Oman, and Ghana.
Turning to slide 14, you can see how this tenancy growth has translated into strong revenue performance, with quarterly revenue increasing by 17% year-on-year to $252 million. A substantial base of our contracted revenues underpins that growth, with approximately 70% of revenue coming from investment-grade customers, and all coming from blue-chip operators.
Our customer agreements typically have initial terms of 10 to 15 years, and are largely non-cancellable. Currently, we have $6.2 billion of contracted revenues with an average remaining life of 6.4 years.
This gives us great visibility into future revenues and provides a strong foundation to then layer on top the growth from incremental tenancy additions. Our hard currency profile also remains very strong, with 69% of revenues and 70% of adjusted EBITDA in hard currency.
Four markets are innately hard currency: DRC is dollarized, Oman is dollar-pegged, and Senegal and Congo-Brazzaville are pegged to the euro. In our remaining markets, we also have a proportion of our revenues being US dollar-linked, adding further to the overall mix.
Alongside this, our contractual CPI and power escalators provide further protection against revenue movements, with inflation escalators typically escalating in Q1, and power price escalators, which move both up or down depending on the local prices, escalating either quarterly or annually depending on the contract. These mechanisms have proven very effective historically, and demonstrated on the next page.
Onto slide 15, we show the usual breakdown of the key drivers of revenue and EBITDA growth. On the left-hand side, organic tenancy growth remains the principal driver of revenue growth, contributing 11% of the total 17% revenue growth, while CPI and FX offset one another.
The 5% power contribution was principally driven by power escalations in DRC, offsetting the associated increase in power costs. As you can see on the right-hand side, they offset when looking at it on an EBITDA basis.
This shows that the escalators protect our dollar EBITDA, which is critical, although does have an impact of slightly reducing margin. Now, our power price escalators move both up or down depending on the local pricing of power.
Here we show it going up with the associated offset. It's worth mentioning that during 2025, we reduced revenue by $7 million due to power price reductions, with the point being that we are not trying to make a margin on these escalators; they work to compensate for what we're experiencing locally.
Looking at the right-hand side bridge, we can see this in action with the key drivers of our EBITDA growth. It's quite clear to see that the key driver of growth is through tenancy additions, with the escalators working to effectively offset macro movements outside of our control.
We've continually demonstrated how the business can convert tenancy growth into dollar growth and returns, and this quarter's performance reiterates that point. As our markets experience long-term demand for mobile connectivity, we have structured our business to capture that growth in a robust and resilient manner, and convert that into compounding dollar returns.
Turning to slide 16, disciplined capital allocation is essential to how we operate and to Impact 2030. Our priority is to invest in high-returning organic opportunities—i.e., colocations, opex initiatives, and selective new builds.
The strong returns on these investments continue to make them the most attractive option available to us to deploy our capital. In the first nine months of the year, our overall capex was $196 million, with $173 million being discretionary capex, resulting in 3,435 tenancy additions, including 942 new sites.
The continued demand we are seeing and its flow-through into our pipeline means we have now tightened the range of our guidance to the top end, and now expect full-year capex to be between $230 to $245 million. Now, this represents a meaningful portion of our Impact 2030 guidance of over $500 million to be spent on discretionary growth investments, reflecting the strong demand we're seeing from customers and the opportunity to invest now in high-returning sites and tenancies.
The $100 million of incremental growth capex announced at our Q1 and half-year results is expected to deliver a return on invested capital of more than 25%, which is an attractive return, and a laser focus on deploying capital and efficiently delivering on these opportunities. Non-discretionary capex remains unchanged at $50 million, while we are pleased to be able to increase planned shareholder distributions to more than $80 million for the year, which includes both dividends and buybacks.
We've spoken previously about being in the cash compounding sweet spot, and we're demonstrating that. We continue to invest in growth, increasing shareholder distributions while deleveraging.
Which takes us to slide 17. We have a strong balance sheet and debt maturity profile, providing us with the financial flexibility to support our growth ambitions.
Our blended cost of debt is 6.7%, with a weighted average maturity of just over three years. After raising a $250 million term loan in May to manage a convertible bond maturity and support general corporate purposes, we now have more than $500 million in available cash and undrawn debt facilities.
With gross debt remaining broadly stable and EBITDA growth, we've seen our net leverage continue to decline, down by 0.2 year-on-year to 3.4. We expect this to further reduce by the year-end.
On the right-hand side, you can see the debt maturity profile, with our main senior note maturities in 2029 and 2031. Our liquidity and maturity profile gives us the flexibility to invest in high-returning opportunities while maintaining balance sheet discipline.
This provides us with a strong financial platform for which to execute our strategy. Which brings us to slide 18, a brief recap of our updated FY '26 guidance and progress towards Impact 2030.
The current trajectory of our performance means we're expecting growth at the top end of our prior guidance on tenancy additions, EBITDA, and recurring free cash flow. Going down the targets, this means we expect roughly 4,000 tenancy additions for the year, a 13% increase in our total tenancy base.
EBITDA guidance is roughly $535 million, a 14% year-on-year increase. Recurring free cash flow guidance is now greater than $235 million, representing growth of 13% year-on-year.
To support the additional organic growth, we are tightening the range of our discretionary capex guidance to $230 million to $245 million, reflecting the opportunity to support customer demand and invest in high-returning opportunities. We're also progressing shareholder distributions as planned, with over $80 million expected this year through both buybacks and dividends.
Overall, you can see on the right-hand column, we are making really strong progress in the first year of Impact 2030, investing in a disciplined manner in growth opportunities to translate customer demand into attractive, compounding returns. To be this well-progressed in the first year of a five-year plan is a great place to be.
As we end the year and get a better sense of demand for next year, we'll be looking forward to updating the market at our full-year results on an updated view for 2027 and also 2030. With that, I'll pass back over to Tom to wrap up.
Tom Greenwood
Thank you, Manjit. Before we move into the Q&A, I'd like to leave you with three key takeaways.
First, we're delivering exceptional operational and financial performance supported by accelerating customer demand. Our customers are increasing investment across our markets, and our world-class operating platform, market-leading positions, and focus on customer experience excellence are enabling us to deliver on this opportunity.
We're on track for around 4,000 tenancy additions this year, significantly ahead of 2025, with a strong pipeline developing into 2027. Second, we're entering the next phase of sustained, high-quality organic growth.
We've tightened our 2026 guidance upwards and expect another year of over 3,000 additional tenancy additions and double-digit EBITDA growth in 2027. Looking further ahead, the structural growth opportunity across Africa and the Middle East remains exceptionally compelling.
Population growth, increasing mobile penetration, and accelerating data consumption provide a multi-decade runway for our business. Third, we're firmly in the cash compounding sweet spot.
Our established platform is generating growing recurring free cash flow and improving returns on invested capital. This enables us to invest in highly attractive organic growth opportunities while simultaneously strengthening our balance sheet and increasing shareholder distributions.
Our recently expanded $175 million buyback program demonstrates our confidence in the outlook and our commitment to delivering sustainable shareholder value. In summary, we're delivering record tenancy growth today with an exceptional runway for tomorrow and an increasingly powerful cash compounding model that will continue to create value for all of our shareholders.
We're very excited about the opportunities ahead and remain firmly focused on delivering on our Impact 2030 ambitions. Thank you for your continued interest and support.
With that, let's open up for questions.
Operator
Thank you. Ladies and gentlemen, if you would like to ask a question via the conference call, please press *1 on your telephone keypad.
Thank you. We will pause for a brief moment.
Thank you. We'll now take our first question from David Wright of Bank of America.
Your line is open, please go ahead.
David Wright
Thank you very much for taking my call. Look, I think it's a very strong print today, it's hard to really sort of pick on anything.
I guess if we think about the guidance, especially the 2030 guidance, the question, as ever, is, is the growth, the tenancy growth, etc., just kind of forward-phased? Because you're obviously running kind of ahead of the curve, or ahead of the straight line on that one.
You're also running ahead of the straight line on capex, to speak, as well. I guess the question is, is this just a little sort of forward-phased, this growth into 2030?
Or are you actually at the point now where you're saying, "No, no, this growth is just so relentless that you're willing to commit more capex to it because of those very, very strong returns on incremental capital?" We could possibly sort of see a shift in the full '30, full-year '30 guidance in that direction.
Maybe a bit more cash flow, but clearly stronger growth as well. I appreciate you're probably not ready to update formally on this, but just the way it's currently trending.
Tom Greenwood
Thanks, David, for your question, as always. I'll say a few words, and then Manjit can jump in as well.
Look, certainly, very strong momentum that we're seeing this year, and huge credit to all of our teams across the business who've been putting in huge efforts to deliver all of these tenancies, and continue to do it right this very second. As you've seen, we've, as usual at Q3, given a kind of early look indication of next year.
That includes a view of over 3,000 tenancies. Now, that, of course, is higher than the consensus currently, which is, I think, around 2,400, and higher than the sort of average five-year view that we gave at the Capital Markets Day last year.
We're already kind of edging up next year. At March, when we release our FY '26 full years, we'll give some updated guidance on that as well.
Certainly the tenancies are coming through. The pipeline is building.
The return on invested capital of these tenancies, which is a mix of colocations, amendments, and build-to-suits covering coverage, capacity, and new technology upgrades, is highly attractive returns. That's number one in our capital allocation policy.
Very pleased with the progress so far, and seeing that continue into next year. Manjit, do you want to...?
Manjit Dhillon
Yeah. I think the other part to kind of mention is, yeah, on that chart that we showed where you see the MNO capex and consensus rising, we're hearing it from MNOs both in terms of their public results where they're saying that they're increasing capex, but we're having it in our conversations too.
The momentum is definitely there from a demand perspective, which is really, really exciting. We're obviously seeing a step change versus what we've seen over the last maybe decade or so.
As we kind of go forward, and particularly as we go through next year, we'll get a better sense of that demand for the back part of our five-year strategy. The positive element is, if we can invest really well in the opportunities we have available now, next year, in the earlier phase of a five-year plan, we kind of capture that run-rate growth.
It means that we're not actually reducing that $400 million buffer that we said at this time last year. You're already accreting that, but also on a higher base, which means actually your debt capacity also goes up potentially, as well.
You're kind of building a stronger business very, very quickly. We're very excited about the potential for 2030, and then we'll give better guidance as we get through the course of next year as well.
David Wright
Makes sense. Thanks for your answer.
Tom Greenwood
Thanks, David.
Operator
Thank you. We'll now move on to our next question from Graham Hunt of Jefferies.
Your line is open, please go ahead.
Tom Greenwood
Hey, Graham.
Graham Hunt
Thanks very much, guys, for the questions. I'll just ask two.
You've got quite a few elements of guidance in your 2030 plan. I just wanted to touch on the tenancy ratio as we think about sites versus colos over the next few years.
Obviously, the growth rate from your customers has been much higher than you've expected, but has the mix of colos versus new sites been in line or different to what you would have expected? If you see more demand for new sites, which ultimately could be sort of three-tenant sites or 25%-plus ROIC opportunities, would you be more flexible on your tenancy ratio kind of guidance versus the overall growth guidance, just to try and sort of think about how you think about the mix of that?
Because obviously, building more sites now, that gives you more runway for ROIC expansion later in the plan. That's a bit long first question.
Then second question, a bit shorter. Just on upgrade capex, you're growing much faster, you're adding much more in terms of infrastructure every year now.
How should we think about that upgrade capex line beyond that you sort of disclosed beyond just pure expansion capex? Thank you.
Tom Greenwood
Thanks very much, Graham. I'll take the first bit on the tenancy ratio.
As a reminder for everyone, our Impact 2030 strategy, the ambitions for 2030, one of them is to be at 2.5 or more tenants per site by that time. Certainly, that's the direction of travel that we're seeing.
As a reminder, this time last year, we were at 2.2 per site; we're now at 2.3 per site. It's very much moving in the direction expected, albeit with just simply larger volumes of both builds and colos coming through.
Really assumptions on that haven't changed, albeit with larger volumes. Still kind of on a medium-term basis, roughly 75/25 colos and builds is the expectation.
That's roughly what we're seeing at the moment. Obviously, that does go up and down a little bit each year, which is expected.
Still very much on track for that. Certainly the pipeline that we're seeing building next year follows that as well.
Manjit, do you want to jump in?
Manjit Dhillon
Sure. I think just another thing to kind of mention on the build-to-suits as well, when we show the vintages, when we do builds, what we're finding at the latest vintages, because we're getting very, very good analytics with our GIS platform, etc., and the competitive tension we're seeing in the markets, which is great as well, we're able to lease up the new builds in about two to three years, which is fantastic.
These are really, really good investments. Investments which, when you get those customers on, may last for a lifetime.
You're really hoping that you can get that and roll it out as quickly as possible. These sites are going through a lot of analytics internally, but also are really, really good investments.
We're very, very happy to spend capital on those. With regards the upgrade capex, typically that relates to the newer portfolios that we purchased.
The new portfolios that we brought into the overall business over the last five years. All things being equal, that will start to phase down to being kind of de minimis, because you would have spent the upgrade capex to get those portfolios to a TowerCo standard.
We spent a lot of capital on that already, but over the next few years, that will wind down, but probably compensated by your growth capex coming through. That's a kind of broad-based mix.
Graham Hunt
Got it. Thanks very much.
Tom Greenwood
Thanks, Graham.
Manjit Dhillon
Thanks.
Operator
Thank you. We'll now take our next question from Roshan Ranjit of Deutsche Bank.
Your line is open, please go ahead.
Roshan Ranjit
Morning, guys. I've got a couple of questions, please.
Perhaps touching on some of the earlier ones around the guidance, and I appreciate it's kind of an early look into '27 where you're saying greater than 3,000 PoP adds. Put in the context of what you said, Tom, around some of the MNOs already highlighting a strong capex profile in the Africa, Middle East region, what, I guess, do you guys need to get increased visibility on that tenant pipeline and growth?
Again, I appreciate if I take on last year's, that started at 2 to 2,500 and has now ended up at 4,000. What gives you that visibility?
Secondly, just on satellites. Now, I think it's becoming kind of increasingly clear that a kind of perhaps D2D satellite technology needs towers and runs in parallel with the use of the telco network.
Are you seeing any interest, any incoming around hosting some sort of technology on your towers? I know at the half-year results, you kind of highlighted that I think there's around 20 satellites 20 towers with satellite dishes on, but are you seeing a pickup in the level of incoming that you are getting to run some sort of technology alongside satellites?
Thank you.
Tom Greenwood
Thanks very much for the question. On the tenancies, look, we're very pleased with the progress that we've achieved so far.
As we get closer to any given year, obviously the clarity on that increases. The sales cycle in this business is anything from a few days to several months, and some tenancies are committed as well.
As we get closer to next year and then into next year, we'll just simply build up more clarity on it. It's just as simple as that.
Where we are now, we're confident of 3,000-plus, which obviously represents a significant uptick from the previous few years in the business, which were around 2,500 each year. Also the consensus.
I think as we get into March, we'll be having even more clarity on that. Definitely look forward to updating everyone then.
The key message here is we're seeing really strong momentum in 2026, and we can see that that momentum is continuing into next year, hence why we've put guidance out there on an early look basis of over 10% EBITDA growth and 3,000 or more tenancies, both of which are higher than the Capital Markets Day Impact 2030 guidance that we provided a year ago. We're really pleased with the progress on that.
On the satellite point, again, it's in our markets, we're seeing a little bit of that around the edges in terms of leveraging the dish technology for backhaul. As you mentioned, we're doing a few sites like that at the moment, which are only being enabled because of the LEO dish satellite solutions that are now available and can provide some level of backhaul in a location where you can't get microwave and fiber doesn't exist there.
We're seeing a little bit of uptick on that. I wouldn't say any particular change since we gave the update at the half-year, but, yeah, we'll be sure to update you as and when there is any further updates on that.
Yeah. Manjit, anything to add on that?
Manjit Dhillon
No.
Tom Greenwood
All good. All right.
Thanks for the question.
Roshan Ranjit
That's great. Thank you.
Operator
Thank you. We'll now take our next question from James Lockyer of Peel Hunt.
Your line is open, please go ahead.
James Lockyer
Yes, thank you, guys. A couple of questions from me.
Just on, I guess, the guidance for Q4, I think you're currently expecting to add I think less tenancy additions in Q4, but the implied EBITDA, I think, increase is higher. I just wonder if you could bridge the gap there.
I hope you got my math is correct on that side. Then just on Project 100, obviously, it's looking to cut diesel usage, but at what fuel price does a hybrid and solar conversion change the economics, and who keeps the savings under the power pass-through contracts?
Manjit Dhillon
Sure. Shall I
Tom Greenwood
take those?
Manjit Dhillon
Yeah. I'll take those.
There's normally a little bit of a lag between the tenancies coming through and then the trading impact as well, because they can come any part of that quarter. Typically what happens is you've almost got a balance sheet end, and then you've got your P&L part when it comes to tenancies.
Normally what we find is that they will come through during the course of the quarter, then as they hit, you then see the impact of those in the subsequent quarter. There's a bit of an impact of that that will come through in Q4.
That's the reason why you see that. You'll see that in previous quarters as well.
Then with regards the second question, if you could mind reminding me?
James Lockyer
It was just around the fuel price and when the hybrid, solar conversion
Manjit Dhillon
The hybrid part.
James Lockyer
people push towards that, yeah.
Manjit Dhillon
Absolutely. We include that within what we call opex-saving initiatives, and some of these have very good returns.
What we're seeing is two things. One, that the price of actually deploying these solutions is reducing, in part because the demand globally is going up for solar panels, batteries, etc.
The technology improvements are really kind of skyrocketing, and as a consequence, it means we can utilize more of those on our sites. We're always looking to do that, because fundamentally, operating a site with fuel is the most expensive form of operating a site for us.
We're always looking at ways in which we can reduce that. Also, the payback metrics are the amount that you're saving on fuel.
If the fuel price is also going up, it makes those initiatives even more valuable. We are absolutely looking at trying to reduce our utilization of fuel, which will not just drive returns, but also improves our carbon footprint as well.
James Lockyer
Okay. Just a final question actually around your geospatial software that you use to sort of help companies plan their sites.
With the increase of different types of satellites, different types of imagery, different types of data that we're getting, how proactive are you being around sort of going to your clients and going, "Actually, we've found that this one's better than that one"? How is your software getting better at picking the right locations for your clients?
Tom Greenwood
I can take this one. We have our own proprietary geo-information system tool, which essentially analyzes the mobile networks, and looks at where more capacity is needed.
This we've had this system over more than 10 years, and it's improved every year. We're really improving the detail each year.
As you say, with the more data available, whether that's through satellites or even crowdsourced information, which is available a lot more now than what it was a few years ago, it really does hone improvement on that. We've also made progress on deep urban settings as well, looking at the limitations of where buildings might block coverage or capacity, and how to solve for that either using small towers in the city, or outdoor DAS, or in-building systems.
We're getting into a lot of detail on that, and that really supports our tenancy rollout. It's really collaborative effort with our customers on that.
That's what we plan to continue to do as we move forward.
James Lockyer
Thank you, guys.
Tom Greenwood
Thanks, James.
Operator
Thank you. We'll now take our next question from Emmet Kelly of Morgan Stanley.
Your line is open, please go ahead.
Tom Greenwood
Hey, Emmet.
Emmet Kelly
Yes, sir. Yep.
Good morning, everyone. Thanks for taking the questions.
Actually got three questions this morning. The first one, please, is on the new tenancy guidance for 2027, the 3,000 new tenancy adds.
Is there any market, or any markets in particular where you are adding or building more than before? I'm just trying to figure out, is the growth kind of broad-based?
Is it skewed towards the big three markets, or are we beginning to see maybe more growth coming through in Senegals or some of the smaller markets? Second question is, bit of housekeeping, can you just give us an update on where you believe wireless coverage stands as a percentage of the population in your big markets like DRC, Tanzania, and Senegal?
I'm just trying to figure out how much coverage there is left to go. Then lastly, just on towers M&A, it's something we haven't talked about for a while.
Towers M&A has been almost non-existent for the past three or four years globally. There's some signs that maybe towers M&A is beginning to return in North America.
Last transaction you did was clearly in Oman, which led to a significant releveraging of your balance sheet. Now your balance sheet is in a much better place than it was three years ago.
Can you just give us an update on what your stance is on M&A? Feels to me like you're more than happy to keep on building rather than buying, but would you maybe consider some smaller bolt-on transactions if any opportunities emerge?
Thank you.
Tom Greenwood
Thanks very much, Emmet, for the for the questions. Shall I take the first one and then you jump in?
Look, on the on the tenancy guidance, we're seeing growth in every market, it is it is broad-based. Obviously, our larger markets, as, you see this year, on an absolute basis, typically get a higher number.
We're seeing rollouts in Senegal, in Ghana, in Madagascar, and some of the, smaller- to medium-sized markets, which is fantastic. This includes a mixture of of coverage, but also capacity, and also technology upgrades.
5G the 5G cycle is basically just starting in most of our markets. It either started a year ago, or it's starting now, or it's starting in the next 12 months.
What comes with that is the need for more densification of the antennas. That leads to, extra colocation requirements, particularly in the urban and suburban areas, sometimes new infill sites which which we put up.
We have a product called an urban lean site, which is a a a sort of slightly smaller tower that we can put up in urban settings. It's got a smaller footprint.
I actually had a video of this on LinkedIn a few weeks ago in Dar es Salaam in Tanzania, if anyone wants to have a look at one. It's a real mixture both across the markets and, the reasons why rollouts are happening, both coverage, capacity, and technology.
Actually on that point, maybe I'll just take the second one quickly, because it links to it. The look, the coverage, the coverage across most markets in Africa is actually, in the in the 90s, 90% levels.
Now, some of this may be very kind of weak 2G coverage, and, therefore, a lot more capacity is is required. I would say DRC is around 50% or so, maybe slightly higher now.
In in in DRC, there's there's, literally millions, 40, 50 million people not yet living in an area with any cellular coverage. Of course, that is changing by the day.
Manjit Dhillon
Yeah. I'll take the last one, which is the M&A.
Actually, one comment on the wireless coverage as well is that if you also think of the subscriber penetration, the number of people using mobile divided by total population, in markets like DRC, it's just above 50%. Whilst you've got the coverage element, if that capacity were to increase—i.e., the number of people using mobile increases, which it is—then you need to increase that capacity.
That's going to be the real driver that we'll see as well. That's why we're seeing kind of urban areas expand, and we're having to put more and more coverage in those areas.
We are expecting that to kind of really be a key driver in due course. Actually, one other data point as well, which is around the kind of growth that we see for next year.
I'll call out Ghana. Ghana's had 5G licenses recently, we expect to see something come through in our numbers during the course of next year is a current expectation, as well as more broad-based growth in the big markets like Tanzania and DRC.
Then just on M&A, again, it is the lower end of our priority. If you think about the year that we've had so far, we're going to be doing over 1,000 sites for the year, which, in the context of our own business, is bigger as a portfolio, if you were to view as a portfolio, than a number of our markets today.
Effectively, we're doing that to some degree, but just in the markets that we're currently in. That's far more attractive for us because you're doing it off an invested capital base, you're doing it with all the expertise we have in the market, with the customers that we already know, and so you're going to get a better return on that.
We are very, very focused on doing that, and that's why new site growth in existing markets, colos, opex, they'll be the things that will be driving organically. Then we're looking at how we then distribute the excess to our shareholders, with M&A kind of being towards the bottom of the ranking.
We do keep our eyes open to opportunities as well, as you would expect.
Emmet Kelly
Super. Thank you very much.
Tom Greenwood
Thanks, Emmet.
Manjit Dhillon
Thanks.
Operator
Thank you. We'll now take our next question from David Lopes of New Street Research.
Your line is open, please go ahead.
Tom Greenwood
Hi, David.
David Lopes
Hi, good morning. Congrats for the strong print.
Most of my questions have been answered, but maybe one or two on your management cash flow. I've noticed that you've introduced supplier financing this quarter.
I was wondering if there is any changes in how you pay your capex. Still on free cash flow, could you comment on working capital for Q4?
Do you expect a reversal? Thank you.
Manjit Dhillon
I can take both of those. On supplier financing, because we're now doing more capex given the guidance that we've given over the last few quarters, we've now entered into some supplier financing arrangements, which just defers some of the payments of those kind of capex items into late next year.
We wanted to split that out because it's now becoming a little bit more of a material element. That's some really good renegotiations that we've done, which means you can effectively get the returns off the investments now whilst delaying the payments later.
Pretty much a big positive for us, and we're quite proud of some of the things we've been able to do there. In terms of trade working capital, what you often find, particularly with our Q1s and Q3s, is that that actually coincides with some of our mobile network operators' full years and half years.
You do sometimes see fluctuations in working capital quarter-on-quarter. What you often find is the first week or a couple of weeks post-quarter end, you get some inflows coming through.
We do expect that to reverse a bit during the final quarter. That's why when we give our recurring free cash flow guidance for the full year, it effectively implies a bit of a reversal in the final quarter, which we're pretty confident about.
David Lopes
Very clear. Thank you.
Manjit Dhillon
Thanks.
Tom Greenwood
Thank you.
Operator
Thank you. With no further questions on the line, I will now hand it back to Tom for closing remarks.
Tom Greenwood
Thank you very much, everyone, for dialling in. Thanks, everyone, for the questions, as always.
Look, we're really excited about Helios Towers at the moment and its prospects for the years ahead. As you can see, the business is firing on all cylinders at the moment, and that momentum is taking us into next year.
We really look forward to presenting to everyone in March, when we will release our FY '26 full year, and of course give some updated guidance at that point as well. In the meantime, if you have any further questions, we're always available 24/7.
Please just get in touch, and we love talking about our business, just pick up the phone. Have a great day, have a great week, and look forward to talking with everyone soon.
Thank you.