Genco Shipping & Trading Limited
Q3 FY2026 · Earnings Call TranscriptNovember 5, 2026
Operator
Good morning, ladies and gentlemen, and welcome to the Genco Shipping & Trading Limited Third Quarter 2026 Earnings Conference Call and Presentation. Before we begin, please note that there will be a slide presentation accompanying today's conference call.
That presentation can be obtained through Genco's website at www.gencoshipping.com. To inform everyone, today's conference is being recorded and is now being webcast at the company's website, www.gencoshipping.com.
We will conduct a question-and-answer session after the opening remarks. Instructions will follow at that time.
A webcast replay will also be available via the link provided in today's press release, as well as on the company's website. At this time, I will now turn the conference over to the company.
Please go ahead.
Peter Allen
Good morning. Before we begin our presentation, I note that in this conference call, we will be making certain forward-looking statements pursuant to the safe harbor provisions of the Private Securities Litigation Reform Act of 1995.
Such forward-looking statements use words such as anticipate, budget, estimate, expect, project, intend, plan, believe, and other words and terms of similar meaning in connection with the discussion of potential future events, circumstances, or future operating or financial performance. These forward-looking statements are based on management's current expectations and observations.
For a discussion of factors that could cause results to differ, please see the company's press release that was issued yesterday, materials relating to this call posted on the company's website, and the company's filings with the Securities and Exchange Commission, including without limitation the company's annual report on Form 10-K for the year ended December 31st, 2025, and the company's reports on Form 10-Q and Form 8-K subsequently filed with the SEC. At this time, I would like to introduce John Wobensmith, Chairman and CEO of Genco Shipping & Trading Limited.
John Wobensmith
Good morning, everyone. Welcome to Genco's third quarter 2026 conference call.
I will begin today's call by reviewing our Q3 2026 highlights and dividend outlook for the remainder of the year. We will then provide additional details on our financial results, as well as an update on the industry's current fundamentals before opening the call up for questions.
For additional information, please also refer to our earnings presentation posted on our website. Beginning on slide 5, during the third quarter, we continue to make meaningful progress executing our comprehensive value strategy, which is generating compelling value and returns for shareholders.
Through the execution of our well-defined capital allocation strategy, we have successfully transformed Genco into a low-leverage, high-dividend company supported by a fleet of premium earning assets, industry-low breakeven levels, and a leading commercial operating platform. Since implementing our comprehensive value strategy in 2021, we have invested $557 million in high-specification modern vessels.
We have also distributed nearly $10 per share in dividends, or approximately 40% of the current share price, while paying down debt, reducing our cash flow breakeven rate, and growing and renewing our fleet. The strength of Genco's comprehensive value strategy was evident in Q3 as we once again capitalized on a robust drybulk market to generate strong earnings and dividends for shareholders.
Notably, strong results in the third quarter reflect our well-timed Capesize acquisitions that have significantly increased our earnings power and dividend capacity. During Q3, we took delivery of our third premium earning vessel this year, the Genco Volunteer, a 2019-built Capesize vessel.
Upon delivery in mid-August, we immediately deployed the Volunteer in the strong Capesize spot market, earning a meaningful premium to the Baltic Capesize Index. Following this latest acquisition, our total investment in premium earning Capesize and Newcastlemax vessels since 2023 stands at $408 million, with asset values having risen significantly since these purchases as Capesizes have outperformed all other drybulk sectors, generating strong returns.
In the third quarter, we drew on our significant operating leverage and earnings power to generate strong cash flow. Specifically in Q3, we achieved our highest quarterly TCE rate since 2022, resulting in adjusted EBITDA of nearly $70 million.
We also benefited from our focus on increasing our dividend capacity, declaring a Q3 dividend of $1.05 per share, the highest quarterly dividend per share in Genco's 20-plus year history. Our Q3 dividend represents a 31% increase compared to Q2 2026 and a 600% increase on a year-over-year basis.
It also marks our 29th consecutive quarterly dividend paid to shareholders, the longest uninterrupted period in our drybulk peer group. As depicted on slides 6 and 7, we achieved multi-year highs for the Q3 dividend, TCE, and EBITDA, and expect to continue to generate strong results for shareholders in Q4 and beyond.
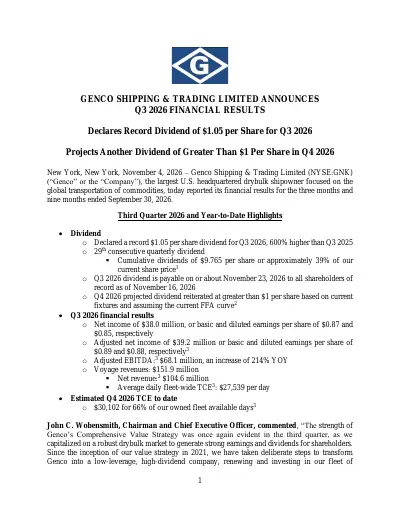
Based on our strong Q4 fixtures to date and assuming the current FFA curve for the balance of the year, we reiterate that the fourth quarter dividend is projected to be over $1 per share for the second consecutive quarter. This would bring our projected full-year dividend to over $3.20 per share.
Turning to slide 8, Genco continues to maintain industry-leading corporate governance, which has underpinned our shareholder-focused outperformance. We maintain a strong and majority-independent board of directors, and we are the only U.S.-listed drybulk shipping company with no related-party transactions.
Moving to slide 9, Genco has one of the lowest cash flow breakeven levels in our peer group, which supports our strong earnings power. This is directly related to our low net loan-to-value, as well as having no mandatory debt amortization.
In addition to significantly increasing our TCE on a year-over-year basis during each quarter this year, we continue to markedly exceed our low cash flow breakeven rate. Specifically, our Q4 TCE to date of over $30,000 per day is nearly $20,000 per day above our cash flow breakeven rate.
On slide 10, we highlight the strategic benefits of our balanced fleet composition. Following the Cape delivery in August, we own a fleet of 20 Capesize and Newcastlemax vessels, as well as 24 Ultramax and Supramax vessels.
Importantly, we continue to balance the upside potential of the Capesize sector along with the steadier earnings profile of the minor bulk ships. On a vessel ownership basis, our splits are 45% Capes and 55% Ultra/Supras.
However, when viewed on a net revenue basis over the last two years, we are over 50% weighted towards Capesize vessels, putting us in a unique position in our peer group to benefit from the strengthening freight rate environment. On slide 11, we highlight the current operating leverage provided by our fleet of 44 vessels.
Every $1,000 fleet-wide TCE increase equates to 36 cents per share of incremental earnings and dividend capacity, while every $5,000 increase in TCE for our 20 Newcastlemax and Capesize vessels equates to an incremental 81 cents per share. Turning to slide 12, we also continue to balance our high operating leverage with our low financial leverage, providing us with flexibility to operate across various freight market conditions.
In stronger markets, we generate meaningful cash flow with our industry-low breakeven rate and scalable fleet. In market downturns, Genco's low financial leverage and undrawn revolver capacity enable us to pursue countercyclical growth opportunities.
Importantly, Genco remains well positioned to continue to drive value and returns for our shareholders and play offense in any type of drybulk market. I will now turn the call over to Peter Allen, our Chief Financial Officer.
Peter Allen
Thank you, John. On slides 14 through 16, we highlight our strong third quarter financial results, which were driven by our sizable operating leverage, growing fleet, and industry-low breakeven levels.
For the third quarter, Genco recorded net income of $38 million, or 87 cents and 85 cents basic and diluted earnings per share. Adjusted net income was $39.2 million, or 89 cents and 88 cents basic and diluted earnings per share, excluding other operating expenses of $0.4 million, impairment on vessel assets of $0.6 million, and an unrealized fuel loss of $0.2 million.
Adjusted EBITDA for Q3 totaled $68.1 million, an increase of over 200% year-over-year. This was led by a time charter equivalent rate of $27,539 per day, which rose by 73% as compared to Q3 2025.
Notably, our cost structure was similar on a year-over-year basis, highlighting the operating leverage inherent in our fleet. We also continue to achieve strong fleet-wide utilization rates of over 98% as we maximize utilization in strong freight rate environments.
Our adjusted EBITDA for the first nine months of 2026 totaled $161.1 million, which is approximately 270% higher year-over-year, already well above the full year 2025 levels, which puts us on pace for 2026 to be our highest earnings year since 2021. We continue to generate meaningful cash flow and maintain significant financial flexibility.
Our cash and debt positions as of September 30th, 2026, were $95 million and $380 million, respectively. Our undrawn revolver availability at quarter end was $300 million, bringing our total available liquidity to nearly $400 million.
With our full revolving credit facility structure, we plan to continue to actively manage our cash and debt positions to reduce interest expense while maintaining access to capital to act on growth opportunities. We view our strong balance sheet as a core component of our comprehensive value strategy and a strategic asset that enables us to act quickly and decisively, as we have demonstrated in recent years with our accretive growth initiatives.
As outlined on slide 17, we believe Genco is in an advantageous position. With a fleet of 44 high-quality modern drybulk vessels, significant operating leverage combined with low financial leverage, a $10,500 cash flow breakeven rate, and $300 million of undrawn revolver availability, we provide an attractive risk-reward balance for shareholders.
Furthermore, we continue to provide shareholders with compelling quarterly dividends. Our dividend policy targets a distribution based on 100% of operating cash flow less a voluntary reserve, as described on slide 18.
In the third quarter, our board declared a record dividend of $1.05 per share, which equates to an annualized dividend yield of 17% based on the current share price. The formula-based dividend is calculated on operating cash flow of $66 million and a quarterly reserve of $19.5 million.
Operating cash flow in Q3 increased by 20% relative to Q2 and rose by over 200% on a year-over-year basis, which flowed through to the dividend. Looking ahead to Q4, we currently have 66% of owned available days fixed at a rate of approximately $30,100 per day, as compared to our anticipated cash flow breakeven rate, excluding drydocking-related CapEx, of approximately $10,500 per vessel per day.
Importantly, Q4 TCE is on pace to increase by nearly 70% year-over-year and reach our highest level since Q4 2021. As a result, we project another dividend of over $1 per share in Q4 2026 to close out a strong year for Genco.
I will now turn the call over to Michael Orr, our drybulk market analyst, to discuss the industry current landscape.
Michael Orr
Thank you, Peter. Beginning on slide 20, during the third quarter of 2026, freight rates continue to rise following a strong first half of the year.
Specifically, the Baltic Capesize 180 Index averaged over $41,000 per day in Q3, the highest quarterly level since 2021, while the Baltic Supramax Index averaged over $19,000 per day, the highest marks since 2022. We believe this strong drybulk earnings environment is due to a continued solid iron ore trade, significant growth in bauxite exports, and a re-emergence of the coal trade.
These demand-side catalysts have extended trading distances, accentuating the existing capacity constraints of the drybulk fleet. Turning to slide 21, China continues to import large volumes of iron ore.
Specifically, China's iron ore imports in the year-to-date have increased by 4%. Australian iron ore exports remain firm, having increased by 3% year-over-year, while Brazilian volumes, after setting a record high in June, have softened in recent months due to a combination of atypical wet weather conditions and high fuel and freight costs impacting smaller Brazilian miners.
Historically, Brazilian exports are approximately 20% higher in the second half as compared to the first half of the year. Capesize vessels in the Atlantic Basin have also been supported by strong bauxite exports originating in West Africa, as highlighted on slides 22 and 23.
Furthermore, Simandou iron ore exports have steadily grown and appear to be ahead of schedule, with 21 million tons shipped in the year-to-date and a record of 5.3 million tons shipped in October. Going forward, given the scale of the expected growth projects from Simandou on the iron ore side, as well as continued iron ore growth from Vale in Brazil and bauxite out of West Africa, these incremental volumes could absorb potentially over 200 Capesize vessels.
Supply constraints and newbuilding activity combined with added long-haul trading distances are two key catalysts for the sector. Furthermore, as detailed on slide 24, with the escalation of geopolitical tensions in recent months, coal demand has been strong.
A confluence of events have supported the coal trade, including a reduction of LNG capacity, gas-to-coal switching in certain Asian economies, a reduction of domestic coal output in China due to safety concerns, and El Niño. Notably, we have seen an increase in coal cargoes originating from the U.S.
and Colombia with Asian destinations. These long-haul trade routes once again further stretch the drybulk fleet.
On slide 25, we highlight the global grain trade. We are currently in North American grain season, in which we typically see increased soybean shipments from the U.S.
to China. China has already increased its purchases of U.S.
soybeans, with year-to-date imports already exceeding all of last year. Peak U.S.
Gulf shipments coupled with potential Panama Canal capacity constraints due to El Niño could result in more drybulk vessels rerouting, extending ton-miles and increasing fleet-wide inefficiencies. In terms of newbuilding deliveries in the year-to-date, as outlined on slide 26, net fleet growth in the first nine months of 2026 was 3.9%, split between 2% net fleet growth for Capesizes and 3% to 6% net fleet growth for Panamaxes down to Handysizes.
Additionally, as scrapping has remained low in recent years, the age of the global fleet has risen to 13 years old, the highest average age of the drybulk fleet since 2010. This has increased the pool of potential scrapping candidates, as 12% of the on-the-water fleet is 20 years or older, which is close to the global drybulk orderbook as a percentage of the fleet of 16%.
This implies net replacement tonnage over time as opposed to any material net fleet growth. While we expect volatility in the freight market to persist, the foundation of a low supply growth picture provides a solid basis for our positive view of the drybulk market going forward.
I'll now turn the call back over to John to conclude the call.
John Wobensmith
Thank you, Michael. Turning to slide 28, the third quarter marked another period of disciplined execution of our comprehensive value strategy, resulting in strong financial results as we generated multi-year high levels of EBITDA and declared a record dividend.
We are continuing to realize the significant benefits of our sizable operating leverage, strong balance sheet, and industry-low breakeven levels that have enabled Genco to increase its earnings power and dividend capacity. We are operating in a strong rate environment, and asset values have continued to increase, which together with strong cash flow generation, has contributed to Genco's increasing net asset value.
As we look ahead, Genco is well positioned to continue driving returns through sizable dividends and creating value for shareholders. This concludes our presentation, and we would now be happy to take your questions.
Operator
Ladies and gentlemen, we'll now conduct the question-and-answer session. If you would like to ask a question, please press star one to raise your hand.
To withdraw your question, press star one again. We ask that you pick up your handset when asking a question to allow for optimum sound quality.
If you are muted locally, please remember to unmute your device. Please stand by while we compile the Q&A roster.
Your first question comes from the line of Omar Nokta with Clarksons. Your line is open.
Please go ahead.
Omar Nokta
Thank you. Hi John, Peter, Michael.
Morning. Thanks for the update.
John Wobensmith
Rates
Omar Nokta
have been moving quite favorably here in the spot market over the past several quarters. I guess we're going on a year now of elevated rates in the sector.
I have maybe a two questions. Maybe one specifically on the market, and then wanted to ask about Genco specifically.
We've seen here recently Capes having jumped. Maybe earlier back in September, they reached $50,000 a day, kind of eased back a bit, found a floor of 30, and they seem to be toggling maybe within this range.
I guess, does that surprise you, what we've seen with rates and them being able to establish a floor at this higher level, at least relative to what we've seen over the past several years? How do you think that, what that tells us about the market, and how do you think the setup is as we look into 2027?
John Wobensmith
I would tell you what that points out is how tightly balanced particularly the Capesize market is, but really the entire drybulk market. From September to where we are today, there were mostly weather-related events that affected the iron ore trade, particularly in the southern system in Brazil, with a lot of wet weather.
That definitely brought deliveries down. Vale, they put out their end of the year guidance, which while was on the low end, it still shows increased iron ore imports on a year-over-year basis.
Our view is that it was fairly weather-related. There is some fuel issues in terms of being very high.
I think there's an incremental 10 to 15 million tons from small iron ore producers in Brazil that cut back on shipments. As we see these bunker prices come down, margins are starting to open up again.
It's really, in the end of the day, you look at the growth in the bauxite trade, you look at Simandou that has been ramping up earlier than anticipated, and I think that has really helped establish a floor with the backdrop of a low supply situation on the vessel side.
Omar Nokta
Thanks, John. That was really good.
Maybe just kind of perhaps Genco-specific. You've been obviously no stranger to acquiring tonnage, as you highlighted in your opening comments.
You've been doing it episodically, really, and at your own pace the past several years. You've got plenty of liquidity.
Then just wanted to kind of ask, as you think about, because you noted asset values continue to rise, what do you think in terms of deploying more capital into the second-hand market? Is there an opportunity there, you think, and especially in the say the sub-Cape segments?
You've got the nine remaining Supras. They're somewhat older.
How do you think about scaling out of those and maybe using that capital to redeploy, perhaps in Ultras, or do you go more top-heavy with the Capes? Any color you're able to give on that?
John Wobensmith
Sure. Look, you saw what we did earlier in the year.
We divested two older Supras and redeployed that into a modern Cape. Very creative trade.
Those are deals that we will do all day long, right? Not always available.
It's still, I think, a tight market to find modern Capesize, but they are out there. There was another 2019 that was just sold over the last two days to another owner.
I still think liquidity is there in terms of ships. When you look at Genco specifically, we're definitely going to continue to execute on the fleet renewal side.
We still have, I would say, a bias towards the larger ships, but the mid-sized ships are very important to maintaining cash flows and dividends because of the stable earnings. I would look at it as, what's the opportunity at the time, with the bigger picture that we will continue to do fleet renewal.
Omar Nokta
Got it. Thank you, John.
I'll turn it back.
John Wobensmith
Thank you, Omar.
Operator
Your next question comes from the line of Liam Burke with B. Riley Securities.
Your line is open. Please go ahead.
Liam Burke
Thank you. Good morning, John, Peter, Michael.
John Wobensmith
Morning.
Liam Burke
John, you did pay for the last Cape and your debt levels are higher, though low by relative standards. Traditionally, you have been paying back debt faster than the normal amortization rates.
Do you see any need to do that, especially with asset values so high here and you may not be able to step in and add assets with the market the way it is?
John Wobensmith
Asset values have gone up. They've gone up, though, across the board, right?
Not just the new ships. The older ships have moved up significantly as well.
There is a trade there that can benefit the fleet renewal side. Again, we have to have discipline as we're looking at transactions.
The debt side, I'll let Peter comment on this, but we have a revolving credit facility, we're actually managing our interest rate risk. You want to fill in?
Peter Allen
Sure. Thanks, John.
Liam, we drew down in Q3 $50 million to fund the balance of the acquisition in August. We look at the revolver availability of 300 and our cash, it's relatively fungible.
We do try to manage interest expense. As you saw in Q3, our cash did build to $95 million, you could see us toggle between the cash and debt paydowns in Q4.
Overall, a lot of financial flexibility, over $400 million or close to $400 million of total liquidity. Our debt balance has increased moderately, but we're still at an 18% net loan-to-value position.
Still low leverage and no mandatory debt amortization at the current time.
Liam Burke
Your debt levels are very low. I think this question is for Michael.
You were talking about iron ore imports to China are up, but if I'm looking at year-to-date China steel production, it's down about 3%. How do we reconcile increased iron ore demand with lower production levels?
Michael Orr
Hi, Liam. Partially, it's also a reduction in domestic iron ore output.
China's had to increase their seaborne imports because of lack of domestic output, which is typically much lower ferrous content than the imports, much higher ferrous content seaborne imports from places like Brazil and Australia.
Liam Burke
This is a trend that'll continue beyond just this year? This is more of a structural change in iron ore demand for China steel, and it's somewhat less sensitive to production levels?
Michael Orr
Yes, and you can see they've also been reaching out to Guinea with extremely high ferrous content and sourcing much more from the seaborne market at the expense of its domestic output. Then
John Wobensmith
Liam, we've also seen growth in some of the, at least right now, smaller areas. Vietnam continues to import higher numbers on the iron ore front.
When we look at India, because of the low ferrous content in their iron ore and their large growth on the steel production side, we actually think you could see a scenario over the next few years where India is importing more and more high-quality iron ore.
Liam Burke
Great. Thank you very much.
John Wobensmith
Thanks, Liam.