Navios Maritime Partners LP
Q3 FY2026 · Earnings Call TranscriptNovember 4, 2026
Operator
Thank you for joining us for Navios Maritime Partners Third Quarter 2026 Earnings Conference Call. With us today from the company are Chairwoman and CEO, Miss Angeliki Frangou, Chief Operating Officer, Mr.
Stratos Desypris, Chief Financial Officer, Miss Erifili Tsironi, and Chief Trading Officer, Mr. Vincent Vandewalle.
As a reminder, this conference call is being webcast. To access the webcast, please go to the Investors section of Navios Partners' website, www.navios-mlp.com.
You'll see the webcasting link in the middle of the page, and a copy of the presentation referenced in today's earnings conference call will also be found there. Now I will review the safe harbor statement.
This conference call could contain forward-looking statements within the meaning of the Private Securities Litigation Reform Act of 1995 about Navios Partners. Forward-looking statements are statements that are not historical facts.
Such forward-looking statements are based upon the current beliefs and expectations of Navios Partners' management and are subject to risks and uncertainties which could cause actual results to differ materially from the forward-looking statements. Such risks are more fully discussed in Navios Partners' filings with the Securities and Exchange Commission.
The information set forth herein should be understood in light of such risks. Navios Partners does not assume any obligation to update this information contained in this conference call.
The agenda for today's call is as follows: first, Miss Frangou will offer opening remarks; next, Mr. Desypris will give an overview of Navios Partners' segment data; next, Mrs.
Tsironi will give an overview of Navios Partners' financial results; then Mr. Vandewalle will provide an industry overview; and lastly, we'll open the call to take questions.
Now I turn the call over to Navios Partners' Chairwoman and CEO, Miss Angeliki Frangou. Angeliki?
Angeliki Frangou
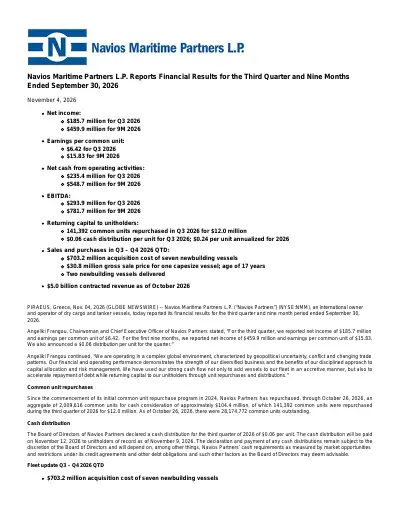
Good morning, and thank you all for joining us on today's call. For the third quarter, we reported net income of $185.7 million and earnings per common unit of $6.42.
For the first nine months, we reported net income of $460 million and earnings per common unit of $15.83. We also announced a cash distribution per unit for the quarter of 6 cents.
We continue to operate in a complex global environment characterized by geopolitical uncertainty, conflict, and changing trade patterns. Our performance demonstrates the strength of our diversified business and the benefits of our disciplined approach to capital allocation and risk management.
During the third quarter, Navios used its strong cash flow to add vessels to its fleet. We made an investment of over $700 million to acquire seven newbuilding vessels: four container ships, which were chartered out for about $400 million of revenue, and three newbuilding tankers, which are subject to ongoing discussion for charters of five years or longer.
In addition, we accelerated repayment of $90 million of debt maturing from 2028 through 2030. Turning to slide 3, our fleet has an average age of 8.5 years compared with an industry average of 13.8 years.
Our tanker fleet, with an average age of 4.9 years, is particularly young compared with the industry tanker fleet average of 14.2 years. We believe the youth of our fleet provides a competitive advantage through, among other things, lower operating costs, better fuel efficiency, and stronger charter preference.
Please turn to slide 4. Navios is a leading maritime transportation company, owning and operating a modern fleet of 182 vessels across three segments and 15 asset classes.
Our in-the-water fleet is split into thirds, with about 1/3 of the value in each of the tanker, drybulk, and container segments. Overall, this fleet is valued at approximately $8.7 billion, with a $6.2 billion in-vessel net equity value.
Our fully delivered fleet has an estimated charter-free value of approximately $12.4 billion. We have contracted revenue backlog of approximately $5 billion, providing significant visibility into future earnings and, importantly, providing coverage past 2030.
At the quarter-end, we had a net LTV of 23.1%. Our balance sheet is strong, with $657 million available liquidity and credit ratings of Ba3 from Moody's and BB from S&P.
Please turn to slide 5. We maintain a disciplined risk management culture, continuously monitoring and assessing our exposure, diligently evaluating and structuring transactions, and maintaining robust insurance coverage, particularly important in a war-risk environment.
Our focus is on building a business capable of generating value across multiple market cycles. We couple this culture with diversification, and together, our platform provides optionality across markets.
Please turn to slide 6, where we outline our recent developments. I previously mentioned that Navios earned net income of $185.7 million, or $6.42 earnings per common unit, during the third quarter.
As to our balance sheet, approximately 44% of our debt carries fixed interest rates, providing protection against interest rate volatility, while 52% of our debt has no loan-to-value covenant. Our debt maturity profile is staggered, limiting near-term refinancing pressure, and we have 62 debt-free vessels worth around $2.4 billion.
During Q3 and through the fourth quarter to date, we committed approximately $703 million to the acquisition of seven newbuilding vessels. These acquisitions included four 10,100 TEU container ships, one VLCC, and two MR2 product tankers.
We also entered into a long-term contracts for $735 million. In addition, we agreed to sell a 17-year-old Capesize vessel for $30.8 million.
We continue to replace older assets with modern vessels while seeking to secure attractive employment. Please turn to slide 7, where we address our return of capital.
We authorized an additional $200 million common unit repurchase program in 2026. Since the program commenced in the second quarter of 2024, we repurchased approximately 2 million common units for a total consideration of $104.4 million.
This reduced outstanding common units by 6.7%, from approximately 30.2 million to 28.2 million. These repurchases are particularly attractive when our units trade at a meaningful discount to the underlying asset value.
The average analyst estimate to our net asset value is at approximately $187 per unit. Thus, repurchases since 2024 have generated approximately $202 million in estimated net asset value accretion, equivalent to $6.90 per unit.
Over the last 12 months, we have returned approximately $48 million to unit holders through repurchases and cash distributions. In allocating capital to a unit repurchase program, we consider the relative attractiveness of alternative uses of capital, including the availability of investments that can enhance long-term cash flow generation, the preservation of liquidity, maintaining prudent leverage, and safeguarding balance sheet strength.
All of this must be considered in the context of an industry that changes quickly. Please turn to slide 8, where we review Navios' track record over the past five years.
We are focused on building a platform of excellence. Over the past five years, we have grown contracted revenue by about 50% to a record of $5 billion.
We have an EBITDA run rate of over a billion dollars, and have expanded our fleet value, including our newbuilding program, to around $12.4 billion. Importantly, we have not sacrificed financial discipline in the process.
We reduced our net loan-to-value to 23.1%. We recognize that there is more work ahead, but in an uncertain world, we believe our proven platform, combining a diversified fleet with a disciplined risk management culture, positions us to continue delivering value through any market condition.
I now turn the presentation over to Mr. Stratos Desypris, Navios Partners' Chief Operating Officer.
Stratos?
Stratos Desypris
Thank you, Angeliki, and good morning, all. Please turn to slide 9, which details our operating free cash flow potential for Q4 of 2026 and full year 2027.
For the fourth quarter of 2026, we fixed 80% of available days at a net average rate of $31,837 per day. Contracted revenue exceeds estimated total cash operating costs by $133.6 million, and we have 2,713 remaining open or index-linked days, offering additional upside.
Even for 2027, our contracted revenue already exceeds estimated total cash operating costs by $4 million. We have fixed 56% of our available days at a net rate of $29,605 per day, and we still have 25,220 days open or index-linked that will provide significant additional free cash.
Every $1,000 per day on those days creates over $25 million of additional free cash. Moving to slide 10, our contracted revenue backlog provides strong earnings visibility.
Taking advantage of the current strong rate environment, we continue to grow contracted revenue. Since the start of the third quarter, we added approximately $735 million: $537 million from eight container ships, $145 million from four tankers, and $53 million minimum revenue from two drybulk vessels.
Total contracted revenue reached a record high of $5 billion: $2.1 billion for tankers, $2.6 billion for container ships, and $0.3 billion for drybulk. Charters are extending through 2037 with a diverse group of quality counterparties.
Slide 11 summarizes the fleet developments for Q3 and Q4 quarter to date. We agreed to acquire four scrubber-fitted and shore-power-fitted newbuilding 10,100 TEU container ships, with delivery expected in second half of 2028 and first half of 2029, for $488 million.
We also agreed to acquire one newbuilding scrubber-fitted VLCC, expected to be delivered in Q4 of 2029, for $124 million, and two newbuilding scrubber-fitted MR2s for $91.2 million, with expected delivery in the second half of 2029. We also sold one 17-year-old Capesize vessel for $30.8 million.
Additionally, we took delivery of two newbuilding vessels: one MR2 vessel, which is chartered out for about five years at a net daily rate of $23,400, and one 7,900 TEU container ships chartered out for about four years at a net daily rate of $42,463. We continue to actively renew our fleet to maintain a young age profile.
We have 34 newbuilding vessels delivering to our fleet through 2029, representing $3.1 billion of investment. We have mitigated residual value risk of our newbuilding program with long-term creditworthy charters, expected to generate about $2.3 billion in contracted revenue over a five-year average charter duration.
Moving to slide 12, our diversified fleet provides both revenue visibility and market exposure. For 2027, we have 57,947 available days, of which 56% are fixed and 44% are open or index.
Our chartering strategy takes advantage of each segment fundamentals. Container ships are 98% fixed, anchoring our cash flow.
Tankers are 72% fixed, providing stable, healthy cash flows, but also significant upside optionality. Drybulk is also where significant upside sits: 87% of our 2027 drybulk days are open or index, which is nearly 80% of all our open days.
That reflects our approach: we fix long-term when the market pays, and we stay short when it does not. Drybulk rates were weak for a prolonged period, period charters made little sense.
As charter rates improved, we have begun adding cover, such as the five-year Capesize newbuilding charter with a floor of $26,000 per day plus profit sharing. I now pass the call to Erifili Tsironi, our CFO, who will take you through the financial highlights.
Erifili?
Eri Tsironi
Thank you, Stratos, and good morning, all. I will briefly review our unaudited financial results for the third quarter and the first nine months of 2026.
The financial information is included in the press release and summarized in the slide presentation available on the company's website. Moving to the earnings highlights on slide 13, total revenue for the third quarter of 2026 increased by 25% to $432 million compared to $347 million for the same period in 2025, due to higher fleet combined time charter equivalent rate.
Our combined TCE for the third quarter of 2026 increased by 26% to $30,371 per day, while our available days slightly increased to 13,479 days compared to Q3 2025. In terms of sector performance, the TCE rate for our drybulk fleet and tanker fleet increased by 43% and 38% to $25,708 and $36,183 per day, respectively, compared to Q3 2025.
The TCE rate for our container fleet was 1% lower at $31,619 per day. EBITDA, net income, and earnings per common unit for the third quarter and the first nine months of 2026 were adjusted as explained in the press release and the slide footnote.
Adjusted EBITDA for Q3 2026 increased by $78 million to $272 million compared to Q3 2025, mainly due to the increase in revenue. Vessel operating expenses increased by $3 million due to an 8% increase in daily opex rate to $7,320 due to higher maintenance, repair, and spares expenses, partially mitigated by a 4% decrease in opex days.
Adjusted net income for Q3 2026 almost doubled to $164 million compared to $84 million for the same period in 2025. Adjusted earnings and earnings per common unit for the third quarter of 2026 were $5.70 and $6.40, respectively.
Total revenue for the first nine months of 2026 increased by 23% to $1.2 billion compared to $979 million for the same period in 2025, due to higher combined time charter equivalent rate despite lower available days. Our combined TCE rate for the first nine months of 2026 increased by 24% to $28,209 per day, while our available days decreased by 1% to 39,735 days compared to the same period in 2025.
In terms of sector performance, our TCE rate per day was higher in all three sectors, as follows: 45% increase to $22,332 for our bulkers, 29% increase to $33,897 for our tankers, and 1% increase to $31,504 for our container ships, compared to the first nine months of 2025. Adjusted EBITDA for the first nine months of 2026 increased by $198 million to $718 million compared to the same period in 2025.
The increase was primarily driven by the increase in revenue. Fleet opex daily rate was 4% higher than 2025 levels at $7,223, due to higher maintenance, repair, and spares expenses.
Adjusted EBITDA was also negatively affected by a $17 million increase in time charter and voyage expenses, primarily reflecting additional insurance premiums reimbursed by the charterers, and a $4 million increase in general and administrative expenses, mainly due to higher prevailing euro-dollar exchange rate, as well as the increase in legal, professional, and audit fees during the first nine months of 2026. Adjusted net income for the first nine months of 2026 doubled to $396 million compared to $196 million for the same period in 2025.
Adjusted earnings and earnings per common unit for the first nine months of 2026 were $13.60 and $15.80, respectively. Turning to slide 14, I will briefly discuss some key balance sheet data.
As of September 30, 2026, cash and cash equivalents, including restricted cash and time deposits in excess of three months, were $508 million. In addition, we had approximately $150 million available under two revolving facilities.
During the first nine months of 2026, we paid approximately $290 million under our newbuilding program net of debt, and we concluded the sale of five vessels for $185 million, adding about $160 million cash after debt repayment. Long-term borrowings, including the current portion and the senior secured bond net of deferred fees, increased by $87 million to $2.25 billion, following the delivery of eight newbuildings during the first nine months of the year.
Net debt to book capitalization improved to 29%. During the first nine months of 2026, we voluntarily repaid approximately $170 million of debt, including $90 million paid in Q3 2026 relating to seven vessels, which are currently debt-free.
Slide 15 highlights our debt structure. At quarter-end, we had 62 debt-free vessels, including 18 vessels securing our unutilized revolving credit facilities.
We have a diversified financing base consisting of leasing structures in Japan and China, more than 16 active banking relationships, and a $330 million senior unsecured bond trading in the Oslo Børs. In addition, 44% of our debt is fixed at an average interest rate of 6.3%, while 52% carries no loan-to-value covenant.
We have also partially mitigated higher interest rate cost by lowering the average margin on our floating-rate debt and bareboat liabilities for the in-the-water fleet to 1.7%. I would like to note that the average margin for the committed floating-rate debt of our newbuilding program is 1.4%.
Our maturity profile is staggered, with no significant balloons due in any single year until 2030, when the bond matures. Finally, recently we concluded the financing of three newbuilding LR2s for a total amount of $136 million.
I now pass the call to Vincent Vandewalle, Navios Partners' Chief Trading Officer, to take you through the industry section. Vincent?
Vincent Vandewalle
Thank you, Erifili. Strait of Hormuz closure has created a major energy and shipping shock, affecting about 20% of the worldwide crude, product, and LNG flows.
The disruption has tightened tanker availability and driven freight rates for all sizes sharply higher. Rates for VLCCs hit all-time highs, reaching $1.4 million per day, and remained elevated even as oil flows out of the Middle East return to pre-war levels.
Increased crude volumes from the USA, Brazil, Venezuela, and Guyana heading to both Europe and Asia are adding more ton-miles as worldwide stocks have been drawn down and oil demand continues at high levels. Product tanker rates have also risen, with the Baltic Clean Tanker Index reaching an all-time high of 3,015 points last week, 264% higher than its long-term average of 826.
Higher fuel cost and security of supply concern continue to drive the purchase and transportation of commodities and finished goods. This has raised rates for drybulk sector for both Capes and Panamaxes, and has continued to support container time charter rates.
The conflict in Ukraine and effects due to El Niño will also add ton-miles for most vessel types. We expect coal imports to continue at elevated levels while LNG passage through Hormuz remains restricted.
With negotiations between the US and Iran at an impasse and increasing attacks in the Strait of Hormuz and southern Red Sea, vessel utilization will continue to run at high levels, supporting elevated rates for the near term. Medium-term trade adjustment depend on how long oil prices stay elevated and, for example, whether decreased fertilizer availability affects crop supply later this year.
Strategic and commercial crude and product reserves will need to be restocked, which should keep tanker rates elevated over the longer term. However, prolonged Hormuz closure could still trigger a global slowdown on a recessionary demand shock, which could affect all shipping markets.
Please turn to slide 18 for the review of the drybulk industry. Demand growth for drybulk trade has been relatively stable over the last 25 years at about 4% compound annual ton-mile growth.
The current orderbook stands at about 15% of the total fleet and is expected to remain low due to high newbuilding prices, uncertainty about new fuel regulations, yard availability, and general market outlook. The fleet is aging quickly, with 39% of the vessels 15 years old.
With older vessels far exceeding those on order, supply should be constrained over the medium term. Please turn to slide 19.
The main driver of drybulk demand will be strong Atlantic Basin iron ore growth over the next several years, with new projects in Guinea, Brazil, and Liberia. The largest new project is Simandou in Guinea, which started shipments at the end of last year and is expected to ramp up to 120 million tonnes by 2028.
Mid-October year-to-date shipments were about 20 million long-haul tonnes from zero last year. Vale in Brazil has three new projects totaling 50 million expected to start exporting by the end of 2026, and Liberia will add 10 million tonnes of export in 2026.
Other African iron ore export projects has been announced, but awaiting final investment decisions. In total, these 180 million tonnes are all long-haul ton-miles trading, creating demand for an additional 249 Capes.
With the current orderbook of only 228 Capes due by 2028, a further tightening of supply and demand is expected over the next few years, benefiting rates. Overall, the drybulk market looks positive, based on steady long-term demand growth and a constrained supply of vessels.
Please turn to slide 21 for the review of the tanker industry. As to supply, we see a tanker orderbook of 26%.
About 50% of the fleet is already over 15 years old, rising quickly in the next few years. With older vessels exceeding the orderbook and yards offering first deliveries in 2029 or 2030, supply is set to be tight for several years.
Please turn to slide 22. VLCCs reached record spot earnings of $1.4 million/day recently, as a portion of the fleet has been sanctioned, damaged, restricted in trading, or dedicated to ship-to-ship shuttle service through Hormuz.
In all, 28% of the VLCC fleet has been restricted from normal operations, leading to exceptional spot and long-term charter rates. Please turn to slide 23.
Middle East crude oil flows have recently returned to pre-war levels, although their composition has shifted significantly. Increasing use of ship-to-ship transfers, along with export out of the Red Sea and via pipelines, have created more inefficiencies and led VLCC rates to the current extreme elevated rates.
This has also helped Suezmax and Aframax crude tankers rates to rise across the board. The tanker market also looks positive over the medium term, based on a low orderbook compared with an aging and reduced fleet due to sanctions.
Please turn to slide 25 of the review of the container industry. After the COVID pandemic, container ship orders were mainly for the biggest units, with fleet expansion in large vessels set to continue at a high level.
Currently, 73% of the orderbook is for ships with 9,000 TEU capacity or greater, and only 23% of the orderbook is for 2,000 to 9,000 TEU capacity, where Navios is most active. Note that by 2029, more than 50% of the 2,000 to 9,000 TEU fleet will be 20 years or older.
Small segments of the fleet are well positioned to take advantage of shifting trading patterns. As shown on the right-hand graph, growth in non-mainlane trades generally exceed the traditional mainlane trades to the US and Europe due to tariffs and higher growth in developing economies, notwithstanding Iran war-related dislocations this year.
Trades involve the Southern Hemisphere, mostly served by smaller-sized vessels, are expected to see continued health growth as this trade shift continues. Overall, Navios' fleet is well positioned within the container market and continues to benefit from long-term employment with our high-quality charters.
This conclude our presentation. I would now like to turn the call over to Angeliki Frangou for her final comments.
Angeliki?
Angeliki Frangou
Thank you, Vincent. This completes our formal presentation.
We open the call to questions.
Operator
Thank you. If you would like to ask a question, press star one on your keypad.
To leave the queue at any time, press star two. Once again, that is star one to ask a question.
We'll take our first question from Omar Nokta with Clarksons Securities. Your line is open.
Omar Nokta
Thank you. Hi, Angeliki and team, thanks for the update today.
Clearly, very strong results, and you continue to reinvest in the business, divesting older vessels, acquiring newbuildings, primarily with long-term charters. I think obviously a real significant thing that's developed here recently is at least one of the many things has been the reduction in your net LTV.
You've gotten it down to 23%, that's your long-term target, trying to get it to that 20% to 25% range, congratulations on that. I guess now that you're here, is there anything that changes the business approach?
Your market footprint has generally stayed the same within the three main aspects of your business, but does anything change from here? Do you look to be more acquisitive?
Is there a target you want to keep through the cycles with this net LTV? Any color you can give on anything that changes from here based on you reaching your target?
Angeliki Frangou
Number one, I think the target is one thing, but also you can see that we care about return to our investors. As I'm a 20% owner of the almost 20% owner of the equity, we are fully aligned here.
Important thing is you have to see what we have done with our cash this year. In 2026, we spent about $450 million cash in for newbuildings.
We prepaid, in order to reach our LTV numbers, about $170 million accelerated debt repayment, and we returned so far about $40 million return of capital to our investors, $660 million up to now. As the year is finishing, in Q1 we will recalibrate our return of capital and see the conditions at the time.
One thing we have done is we build NAV, and also by pushing NAV, we get our share price to chase this NAV.
Omar Nokta
Thanks, Angeliki. That's good context, and so we'll stay tuned on things as they develop.
Then maybe just kind of as a follow-up, you've had this long-term exposure to the three main segments of shipping, tankers, containers, drybulk. You've obviously invested within all three and recycled proceeds into new ships in those markets.
As you kind of think about where things are, and know there's a lot to think about, and you have plenty of flexibility, but do you see investment opportunities for Navios outside these three core areas within shipping perhaps or any other segments that look interesting from a investment standpoint?
Angeliki Frangou
Listen, the beauty of our platform is that we are able to take advantage of any market, and this is what it makes it unique. I think this is something that we like to stay.
We have a billion dollar in platform on EBITDA generation LTM. We have a very low leverage, and we have the ability, and we have been expanding and building NAV while we are deleveraging.
That platform, and we have a contracted revenue of about $5 billion that allow us to have contracted revenue beyond 2030. This kind of a platform allows you to be able to be opportunistic on what we see as an area to expand.
One thing I want to say, we're very mindful of our investors. Think about, we completed $100 million of a buyback, and we have already announced a $200 million buyback.
What we have done, you have to see it over a period of time. We have over the last five years, we more than double our NAV, we are chasing.
This is our success. We are building that NAV.
On the same time, our share price has increased over 300%. This is not one quarter, not one year.
It's multiple year of effort to provide results.
Omar Nokta
Indeed, and we can see it. Done.
Congratulations on the latest, and we'll see how things develop from here. Thank you so much, I'll pass it back.
Angeliki Frangou
Thank you, Omar.
Operator
Once more, that is star one for your questions. We'll move next to Stephanie Moore with Jefferies.
Your line is open.
Stephanie Moore
Great, good morning, thank you. I guess just as you think about your Q4 VLCC days are fixed at just over, I think, 70%.
How are you thinking about spot versus term coverage from here? Would love to get your thoughts just given where we are in the market, and then appetite as we think about more days are open into 2027.
Thanks.
Angeliki Frangou
Thank you. Hi.
This good question. The beauty of our platform allows her flexibility.
This is depends on the sector and part of a cycle. You will see that the contracted revenue allows to be totally non-biased on where we take the exposure.
If you see for this year, and as Stratos had analyzed very well, is we have a lot of exposure on our drybulk Capesize vessels. We see an opportunity here, and while we keep a lot of vessels on the tanker segment, we have VLCC exposure.
We are opportunistic on where we see the exposure. On the container side, on the other side, we see the nice cash flows as a good bedrock for our visibility.
Stratos Desypris
Just one quick add-on here, Stephanie, on the exposure that we have on the tankers. As Angeliki said, we have a lot of contracted revenue on the tanker side, is about 2.4 billion contracted revenue.
What we have open is about 1/3 of our days with are open for next year. Basically, you will see that these are mostly the VLs that are on spot exposure because there we see the bigger volatility with the bigger upside.
Again, if we also drill down on the other sectors, on the drybulk, where you do not have a lot of very healthy long-term contracted revenue, now we see the market picking up and we see availability of longer contracts. You see that the exposure there is mostly for next year is about 90%, and the vast majority of it is on Capesizes.
Containers, of course, as Angeliki said, we are almost fully fixed for next year because there we capitalize on a very strong market.
Stephanie Moore
Thank you, really helpful. Then just as a follow-up, you booked, I think over $63 million of sale gains year to date, and as I think look at tanker values here that are up well over 40%, maybe with your vessels that are over 15 years old, should we expect asset sales to speed up into 2027, or how should we think about overall sale potentials there?
Thank you.
Angeliki Frangou
I think, Stephanie, you have seen we were very opportunistic on that. Earlier in the year, we sold VLCCs that were 17-year-old.
Today's environment, you are actually generating in a month such numbers that don't make sense. You're making multiples of the value.
Depends on the situation. Where we see value, we will automatically do it.
This is a continuous process. I cannot tell you the moment, depends on the market versus chartering, which we are very disciplined and we will always do.
Even if the chartering opportunity to the market value of the vessel may be equal, we will sell one, keep one. We have this continuous program, and we have done that.
We have sold over a billion, almost $1.2 billion on vessels. This is a continuous effort.
Stephanie Moore
All right, thank you, guys. Really appreciate the time.
Angeliki Frangou
Thank you.
Operator
This does conclude the question and answer portion of today's event. I would now like to hand the call back to Angeliki for any additional or closing remarks.
Angeliki Frangou
Thank you, this completes our Q3 results. Thank you.
Operator
Thank you. This brings us to the end of today's meeting.
We appreciate your time and participation. You may now disconnect.