RS Group PLC
Q2 FY2027 · Earnings Call TranscriptNovember 5, 2026
Operator
Hello everyone, and thank you for joining the RS Group 2026/27 half-year results call. My name is Molly, and I will be coordinating your call today.
During the presentation, you can register a question by pressing star followed by 1 on your telephone keypad, and if you change your mind, please press star followed by 2. I will now hand over to your host, Simon Pryce, to begin.
Please go ahead.
Simon Pryce
Thanks, Molly. Good morning, everybody.
Thanks for joining us today, and thank you for your continuing interest in RS, and welcome to the presentation of our interim results for the six months ended the 30th September 2026, which was a strong half for us where we delivered outperformance in all regions. Our presentation this morning should take about 30 minutes, and we'll have time for questions at the end, but we're conscious that it's a busy day in the market, we'll try to make sure everybody can get away by no later than 10:00.
Presentation materials that we'll go through are already available on our website, and the recording of the presentation and the subsequent question-and-answer session will also be available on the website later today. Before we get into the detail of what was a pleasing first half, we always begin our meetings, as at RS with a values or a health and safety moment.
This morning, I'd like to highlight our Protect What Matters global safety campaign that we launched across the group at the beginning of this financial year. Health and safety has always been an area of focus for the group, and we recognized in 2026—the financial year 2026—that we had some health and safety centers of excellence across the group that consistently outperformed other locations.
Learning from them, we developed and launched Protect What Matters, a global program to remind all our teams that every colleague matters, and that as a team of nearly 9,000 people around the globe, our joint responsibility is to ensure that everybody returns home safely, and at least as good a physical and mental condition as when they arrived at work. It encourages us all to look out for each other, to intervene, to speak up, and to make safe choices every day, and continues to be behind a drive and a focus on physical and mental well-being both within and outside of RS.
To the presentation itself. I'll start by summarizing the half, and I'll also cover what we've seen going on in our markets.
Kate will then take you through our first-half financials, which are nicely ahead of expectations. She'll also explain what's driving performance at both the group and regional level, and we'll conclude with some modeling considerations for the second half.
I'll then briefly touch on the good progress that we continue to make against our multi-year plan, highlighting the key things that we delivered in the first half, and how we are positioned going into the second half as we start to realize some of the exciting RS potential that we've been talking about. We delivered a strong first half, with building quarter-on-quarter momentum and outperformance across all regions, which Kate will dig into shortly.
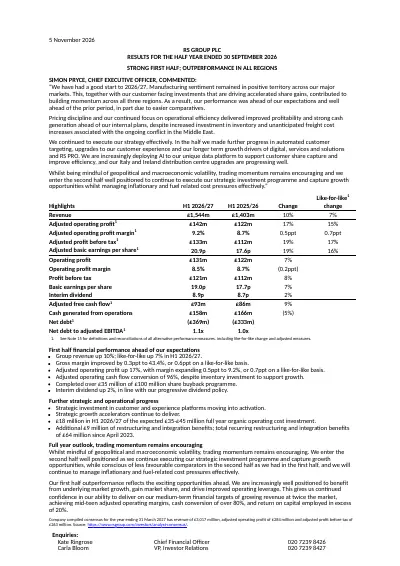
The group returned to growth, with revenue up 10% and 7% on a like-for-like basis. Effective pricing, cost discipline, and better commercial execution led to a 70 basis point like-for-like increase in our operating profit margins to 9.2%, and adjusted profit before tax was up 17%.
The strategic investments we've made over the last couple of years are beginning to deliver, supported by a solid performance from our growth drivers of RS PRO, Services and Solutions, and digital. We continue to allocate capital in a disciplined manner, further investing in the business to support future growth and efficiency, increasing our interim dividend by 2%, repurchasing £35 million of shares as part of our ongoing £100 million share buyback program.
This leaves us with a strong balance sheet of plenty of capacity to pursue a solid pipeline of potentially value-accretive M&A opportunities, and financials that are pleasingly ahead of expectations. One encouraging aspect of the first half was the improvement we saw in our end markets.
As the chart on the left shows, and as flagged at our prelims in May, markets stabilized in the second half of our last financial year. Pleasingly, and despite continued geopolitical and macroeconomic volatility, PMIs have generally continued to strengthen so far this year and have consistently been in expansion territory across all our major markets.
Now, we've talked in the past about the lagged correlation between PMI and RS's organic revenue growth. As the chart on the right shows, whilst that remains true, we are now also benefiting from the momentum generated by investments that we've made to strengthen our proposition and to enhance our capabilities, which are all beginning to deliver results.
In the appendix, we've included the usual charts, which shows this reflected in our continued share gain across virtually all of our product categories. Interestingly, though, and whilst we are seeing accelerated demand in some industry verticals with strong structural growth drivers, such as new energy, pharma, and data center suppliers, the recovery is quite broad-based across most industry verticals that we serve.
Subject to any future macro shocks, I think it's safe to say that our markets have now moved into a recovery phase. I'll now hand over to Kate, who's going to take you through a bit more detail on what's driving performance both at a group and a regional level, as well as some modeling considerations for the second half.
Kate Ringrose
Thank you, Simon, and good morning, everyone. I'd like to echo what Simon has said.
We have made significant progress against our strategic priorities, and while the external environment is becoming increasingly supportive, the business is in a far stronger position than it was two years ago. That momentum is evident in our first-half performance.
We delivered healthy top-line growth, improved profitability, and margin expansion, while maintaining disciplined control of pricing, costs, and working capital. Simon has already highlighted our revenue and profit performance, I'll summarize briefly the highlights in cash and capital.
Cash generation remained strong, with adjusted operating cash flow conversion of 96%, supported by disciplined working capital management, including appropriate inventory investment to support increased customer demand. Improved profitability, combined with strong cash control, supported an increase in return on capital employed to 16.5%.
Consistent with a progressive dividend policy, we have increased the interim dividend by 2%. We have executed £35 million of share buybacks during the period, and our leverage is at 1.1 times net debt to adjusted EBITDA, providing flexibility and capacity to support both organic and inorganic future growth.
As you can see from the bridge, revenue increased 10%, with like-for-like revenue growth of 7%. This was driven by a combination of volume recovery and pricing actions, with volumes contributing around 4 percentage points and price contributing around 3 percentage points.
We have benefited from the recovery of the temporary disruptions post the rollout of the digital platform in the US and the distribution center closure in EMEA. Inorganic investment added £33 million of revenue in the period.
Revenue growth was most evident in average order value, which increased by 10% to £293. The drivers behind the increase include pricing actions, greater customer spend consolidation, particularly within EMEA, and growth in larger orders as a proportion in the Americas.
Digital revenue increased 5%, and Services and Solutions grew 6% on a like-for-like basis, both supported by continued growth in our strategic procurement solutions. RS PRO grew 5% on a like-for-like basis, with particular strength in APAC and encouraging growth in the Americas.
This reflects the strength of our differentiated position and the benefits of our ongoing investment in customer-facing digital capabilities. Turning to our adjusted operating costs, as you can see, adjusted operating costs increased 9% to £528 million and represent 34.2% of revenue, which is broadly consistent with prior year.
Adjusting for forex and prior-year one-offs, and removing restructuring and integration costs, our ongoing cost base starts at £486 million. Here is where I provide you with a bit more detail on our operating cost base and how it responds to changes in revenue.
Let me take a moment to explain the hatched bars. First, I isolate organic opex, being in-year opex investment we are making to deliver our strategy.
This was £18 million both this half and for the same period last year. Much of this investment is on our digital replatforming project and increased spend on the process and operational excellence program.
Of the remaining run costs of £468 million, our analysis tells us 43% moves with revenue and 57% is fixed. In the half itself, as revenue increased by £101 million, variable costs increased by £15 million.
These costs include freight and packaging, variable warehouse costs, marketing, field sales, and customer services. The increase as a proportion of revenue is slightly elevated because of the increase in freight costs associated with higher energy costs.
Fixed costs increased by £17 million, including underlying inflation and rebasing of our long-term, share-based employee incentives. Employee in-year incentive cost accruals increased by approximately £7 million in the first half, reflecting stronger-than-expected performance.
These increases were partly offset by continued restructuring and integration benefits of £8 million, which more than cover the cost required to deliver them. We have now delivered £64 million of recurring benefits, which has been net cost to deliver of £21 million.
We spent £18 million on organic opex in the first half, which is the same as H1 last year. We continue to balance cost investments to support revenue growth and the delivery of operating leverage.
The step-change in process efficiency to realize cost savings and improve operating leverage is expected to take around three years to deliver, with benefits weighted to the back of that period. Looking at operating margin on a comparable basis, which isolates acquisition impact and one-offs, we delivered a strong 100 basis point improvement in operating margin in the six-month period.
Gross margin expansion contributed around 70 basis points of benefit, reflecting our progress in strategic pricing initiatives and robust inventory management. Revenue growth and the resulting operating leverage contributed a further 130 basis points.
Higher fixed costs, combined with cost-reduction actions, reduced net margins by 50 basis points. We have increased annual incentive cost accruals to reflect the better-than-expected financial performance.
The inclusion of BPX reduced operating margin by 20 basis points, such that adjusted operating margin outturned at 9.2% for the half. EMEA delivered a strong return to growth, with like-for-like revenue up 5%, and momentum accelerated through the half as market conditions improved.
Volume growth returned, complemented by targeted pricing actions and continued share gains. Manufacturing sentiment strengthened across our key markets, with PMI levels moving sustainably above 50, supporting a recovery in customer demand.
Growth was broad-based across product categories, whilst all customer segments increased. Our high-potential corporate customers grew 9% like-for-like, reflecting the benefits of our targeted customer proposition, enhanced sales execution, and deeper customer engagement.
Digital revenues increased 5%, driven by our procurement solutions platform, while RS PRO grew 4%. Gross margin was broadly stable year-on-year.
Operating margin improved to 10.4%, reflecting good operational leverage. It's worth taking a deeper look into EMEA to highlight the progress we are making across our major markets.
As these charts show, six quarters of revenue performance, the dotted line indicates when PMIs turned from negative to positive. As you can see, all markets returned to growth by the fourth quarter.
Thematically, the region is executing well against its strategy and making use of the customer and data-led tools that we're rolling out. There's also clear recovery in previously challenged markets, notably DACH and rest of EMEA, which have also benefited from orders returning post the distribution center closure last year.
While on the face of it, growth in France optically slowed, this remains a good performance given the market share gains France achieved during more challenging periods. Investments in our proposition continue to gain traction, helping to differentiate our offer, deepen customer relationships, and create new growth opportunities.
As PMIs remain in positive territory and customer activity builds, we are seeing higher order values and broader-based growth, increasing our confidence in EMEA's momentum and ability to capitalize on a recovering market. Turning to the Americas, Americas delivered a strong performance, with revenue up 9%.
Growth was visible across the region, driven by volume, strategic pricing actions, and continued commercial execution. In the US and Canada, revenue grew 12% on a like-for-like basis, of which we attribute around [unclear] last year of the digital commerce platform.
This demonstrates a healthy underlying trend, with performance supported by targeted supplier programs, enhanced sales execution, and improving digital performance. Web revenue is up 13%.
Services and Solutions continue to gain traction, reflecting growing customer demand for technical support and custom order capabilities. RS PRO grew by 30%, albeit from a low base.
Mexico delivered 9% growth, with recovery accelerating through the period. Underlying demand strengthened, and larger capital projects that had been deferred amid trade-related uncertainty have increasingly moved into execution, supporting improved momentum.
Profitability improved significantly, with gross margin increasing 110 basis points through pricing initiatives, discount optimization, and inventory provision favorability. Combined with disciplined cost control, this drove a 25% increase in operating profit to £44 million and a 120 basis point improvement in operating margin to 9.4%.
Asia Pacific delivered an excellent performance, with revenue up 15%, driven primarily by 12% volume growth as supported by a favorable demand environment. Momentum accelerated through the half, benefiting from continued investment in AI infrastructure and data center expansion across the region.
While all our core categories were in growth, there was particular strength in semis and passives. Greater China and Southeast Asia were standout performers, while Japan and Korea also delivered strong double-digit growth.
Australia and New Zealand delivered 1% growth, primarily reflecting softer market conditions and a reduction in demand from the oil and gas sector in Australia. Across the region, our strategic sales, digital, and marketing initiatives drove digital revenue up 12%, and RS PRO grew 16% on a like-for-like basis, highlighting the strength of our proposition and continued market traction.
Operating profit more than doubled, with operating margin improving to 6.2% as the region delivered operating leverage through cost control. Adjusted free cash flow increased to £93 million, up from £86 million last year, reflecting higher operating profit, partially offset by additional investment in working capital to support growth.
Despite stronger trading, we maintained tight control of working capital, which as a percentage of revenue remained stable at around 24%, while inventory turns were maintained at 2.7 times. This demonstrates the discipline with which we are managing stock levels, ensuring we can support customer demand while continuing to generate strong cash returns.
As a result, adjusted operating cash flow conversion was 96%. Net capital expenditure reduced modestly to £23 million from £25 million last year, largely reflecting the completion of our park management system investment and the phasing of our Italy and Ireland distribution center relocations.
Net debt increased by £40 million, principally reflecting lease additions. The share buyback and dividends have been largely funded by cash generated from operations.
As I've already mentioned, leverage remains at the lower end of our target range at 1.1 times net debt to adjusted EBITDA, providing significant financial flexibility. We have shown this slide before, I'm not going to spend too much time on it other than to reiterate our disciplined approach to capital allocation.
We continue to invest organically in the business, funding the capabilities, technology, and infrastructure that support long-term growth. We have an increasingly healthy M&A pipeline and will continue to be value-disciplined in our pursuit of opportunities that are strategically compelling and meet our financial criteria.
We remain committed to progressive dividend growth, with today's dividend calculated mechanistically at around 40% of the prior-year full dividend. Finally, we continue to return surplus capital to shareholders through our share buyback program.
This balanced approach ensures we can invest for growth while maintaining a strong balance sheet and delivering attractive shareholder returns. Finally, this slide aims to give a bit of color as to what to expect in the second half of the year.
Gross margin is expected to be stable. As per our definition on the cost slide earlier, ongoing run costs exclude the strategic organic opex investments we are making.
We expect variable and semi-variable costs to be consistent with H1 levels at around 14% of revenue. These costs are currently 43% of the run cost base.
We expect H2 2026/27 fixed costs to grow by 7% versus the prior period, net of cost savings. These are currently 57% of the ongoing run cost base.
The guidance we gave at the full-year results in May holds for the organic investment, which will accelerate in H2, as well as the restructuring and integration costs and capital expenditure. Overall, our cost outlook remains controlled, balancing investment for future growth with disciplined cost management and ongoing productivity optimization.
With that, I'll hand back to Simon.
Simon Pryce
Thanks, Kate. As we set out our five-year plan just over two years ago to introduce more agility, more connection, and greater scalability into our business to support accelerated growth, with increased automation and to materially improve productivity and operational efficiency across the group.
A lot of good stuff has been going on since. The wheel on the left shows the five main areas that we're focusing on.
Much of our initial investment has been on strengthening our customer-facing capabilities and core technology foundations, which I'll talk to in a bit. In the first half of this year, as the shading shows in the wheel, the £23 million of capital and £18 million of opex investment that Kate just referred to has shifted more to improve our customer experience and to accelerate operational efficiency and excellence.
On the right-hand side of the slide is the investment roadmap that we shared with you in May that set out all the major initiatives that are embedded in our plans. Pleasingly, we continue to make good progress, and all of those programs remain broadly on track, and some of our early investments are already beginning to deliver.
In the next couple of slides, we'll go into a deeper dive in those areas where we're seeing real progress. At the beginning of Q2, we connected our customer platforms, which provides us with the foundation of a connected customer intelligence capability.
We've begun optimizing and automating data flows between those platforms and have already used this intelligence to launch 12 automated sales campaigns, enabling the immediate creation and activation of leads and opportunities. We've also launched our first supplier-sponsored campaign, combining customer segmentation, personalized digital content, and automated targeted communications.
We're embedding AI across these platforms, which is helping us to process data and identify opportunities faster, and to enhance personalization and marketing effectiveness. Together, these capabilities are strengthening customer acquisition, increasing share of wallet, and supporting more effective commercial decision-making across the group as we start to turn our unique customer data into accelerated growth.
Investments made in the first half to enhance our customer journey are also using AI to deliver smarter customer experiences. AI is helping customers find relevant products more quickly and easily, and we're using it to enhance traditional search and also to develop conversational search to further improve our discoverability.
We're localizing some of our SEO capabilities with the creation of four hubs in our major markets, which will allow for more personalization and relevant merchandising, and strengthening our presence across both traditional and AI-enabled search as customers' buying behaviors continue to evolve, ensuring that we remain relevant and are more relevant and accessible across all channels that we serve customers through. We continue to tune our upgraded digital commerce engine in the US, where, as you heard a little earlier, web sales are up 13%.
The next version, which represents a material upgrade, is now in live testing and ready for launch in Switzerland in Q1 next year, and for more broader market-by-market rollout thereafter. Through AI and digital innovation, we are constantly enhancing our digital experience, enabling faster development, improved agility, greater personalization, and enhanced customer engagement.
In Services, we made good progress in the half in our technology-enabled procurement and outsourcing solutions. E-proc revenue increased by 8% on a like-for-like basis.
During the period, we rolled out our upgraded Purchasing Manager platform across Europe, improving functionality and customer engagement. We have deployment plans for Purchasing Manager across APAC and Americas next.
In Mexico, we successfully deployed a new SaaS-based e-procurement model for project customers, helping them to improve purchasing control, compliance, and providing spend visibility whilst reducing implementation effort. This SaaS version of e-proc is more scalable and creates a great opportunity to expand e-procurement adoption into our project-based customers as well as to our MRO customers over time.
In RS Integrated Supply, we continued enhancing our RS Synq proprietary inventory management and procurement processing platform, with AI-enabled parts identification, a global data cleansing solution, improved multi-site inventory visibility, and curated customer marketplaces. All of these developments are creating much deeper customer engagement and integration.
Alongside our customer-facing initiatives, we continue to invest in the physical and process infrastructure of the group. During the half, we made good progress upgrading our distribution centers in both Ireland and Italy, where we expect to transition to our new sites in the second half.
This will provide a safer and more efficient working environment in those markets, as well as providing additional capacity to support future growth across EMEA. In support of our DC move in Italy, we've also developed and are now deploying our next-generation approach to automation and warehouse management.
This will become the template for future automation across all our regional distribution centers. We also progressed our process and operating excellence program, with data harmonization going well, and we've now moved into detailed process design phase, well in advance of a phased rollout that's not expected to start until 2028.
This will allow simplification and automation of processes, and also allows us to start the next phase of technology and maintenance cost reduction, improved supply chain and back-office efficiency, which will ultimately lead to a lower-cost and more scalable operating platform that will support future growth and improved sustainability and efficiency. To conclude, as I hope today's presentation demonstrates, I'm pleased with these results, which are beginning to reflect the strategic progress that we're making.
Our strong performance is driven in part by improving markets, but also by share gain, by cost discipline, and improving commercial execution. Whilst mindful of macroeconomic and geopolitical uncertainty, PMIs across our major markets remain in positive territory and support the encouraging momentum we have going into the second half, although we must not forget that comparatives do get a bit more challenging.
As we are increasingly demonstrating, our markets continue to have attractive through-cycle growth characteristics, supported by strong growth drivers, and our differentiated proposition positions us well to take advantage of an increasingly data- and AI-enabled world and more fragmented supply chains. Our strategy and investment plans are sound, and we're executing effectively, and some of the strategic investments we've made over the last couple of years are really beginning to deliver.
We continue to demonstrate solid cash generation characteristics and disciplined capital deployment, with a strong balance sheet that supports continued organic investment and a solid pipeline of potential consolidation opportunities to accelerate that growth, subject, of course, to value accretion. After a good first half, we enter the second half with encouraging momentum and are well positioned for continued progress, all of which gives me further confidence in the RS value creation opportunity and in our medium-term financial targets that are set out on the right of the slide.
That's the end of the formal presentation, and thank you for listening. We're now happy to take any questions you might have, and so I'm going to hand you back to the operator, Molly, who will facilitate the Q&A session.
Operator
Thank you very much, Simon. To ask a question, please press star followed by 1 on your telephone keypad now, and if you change your mind, please press star followed by 2.
When preparing to ask your question, please ensure that your device is unmuted locally. We have our first question from Tom Callan at Investec.
Tom, your line is now open.
Tom Callan
Thanks. Morning, chaps.
Hope you're well. Two from me, please.
Firstly, just on that updated opex guidance, I just wondered if you could give us a bit more color as to how we should be thinking about that fixed cost component in FY28. Then just on like-for-like, just wondered if you could give us a flavor as to the Q2 exit rates by region, just so we have a better idea as to what to assume around the top line for H2.
Thanks.
Simon Pryce
Morning, Tom. Thanks.
I'll let Kate take opex, and then I'll take the like-for-like exit rate very briefly. Shall
Kate Ringrose
I do the opex first? Sorry, I wasn't sure whether you were going first or the second one.
Hi, Tom. Good morning to you.
With regards to fixed costs, I recognize that I'm kind of asking you guys to refresh your models a bit. What I would focus on in '28 is that ratio split, the 43% to 57%.
Clearly, inflationary pressures continue to be a thing that we are all collectively managing. The one thing, though, that I would point to in '28 is, if you look at the ratio between depreciation and capex, we're currently running at around £40 million depreciation versus a capex spend that's been sitting at £50 million for a few years, and I expect that to catch up.
That's probably the only kind of real change I see '27 into '28 that you need to factor into. Otherwise, it will be around cost inflation and then that ratio that I've taught you before.
Simon Pryce
On the momentum going into the second half by region, Tom, won't surprise you, we don't guide to that, but there are some clues in our announcement today. We do refer to building momentum, we have seen improving growth in all regions Q-on-Q, and that momentum remains pretty strong exiting the half.
We shouldn't forget, though, comparators do get a bit more difficult in the second half. Whilst there are some slight tweaks around the respective strength of that momentum, I think all the clues for the second half are sort of set out relatively clearly.
Tom Callan
Really clear. Thanks, guys.
Operator
Thank you very much, Tom. Our next question comes from David Brockton at Deutsche Numis.
David, your line is now open.
David Brockton
Good morning. A few questions from me, please.
Firstly, just in terms of product range, when I look at the growth, it seems to be electronics and A&C-led, with MRO, I guess PPE, etc., still somewhat lagging. Is your sense that the MRO component starts to pick up given that's lagged to PMIs, and within A&C, what does the book-to-bill look like in the Americas?
Second question, just in respect of Mexico, you eloquently set out how there was a transactional headwind to the Mexican performance in the second half of last year. Can you confirm whether that transactional headwind still impacted the group in Mexico through H1, and therefore was the like-for-like exing that even better?
Then the final question, a minor one, just in terms of the £1 million exceptional cost, which I think was for an acquisition, can you confirm whether that's an acquisition that didn't complete or an acquisition that's ongoing? Thank you.
Simon Pryce
Tom, on product range, you're right that A&C and certain elements of electronics are growing quite strongly, but actually, if you look at all the product range, we're growing in virtually all of them at relatively decent pace. I do think that there is a little bit of catch-up going on, but also, we are supplying into industries that do have structural growth drivers that are our automation and our electronics product range.
There has been a pickup in things that would be traditionally associated with MRO. I'm not sure that I see any great acceleration.
I don't actually see any great slowdown either. It does feel to me that, and we do look at our growth not just by range, but by industry vertical across the globe, this is a pretty widespread recovery now.
There are pockets of industry verticals that are growing faster than the rest, but it is pretty broad-range, and you're seeing that also reflected in the growth in our product categories. On the £1 million acquisition, I don't really have anything to add to the £1 million of acquisition-related costs.
There'll always be something there whether we buy anything or we don't. Then, Mexico, Kate?
Kate Ringrose
On Mexico, David, it's become very clear to us in Mexico that this is a dollar-denominated business and has become progressively even more so. As a result, the results that you see here treat Mexico as dollar-denominated and are therefore a true reflection of the half-on-half performance.
There is no further FX noise related to that, and for modeling considerations going forward, you should treat Mexico as dollar-denominated.
Simon Pryce
I just might add on Mexico, David, Mexico did go through a period where a lot of the larger capital investment projects were delayed as a result of ongoing trade negotiations between the US and Mexico. Towards the end of the half, we did see that start to unwind, and therefore, quite pleased with what's going on in Mexico in Q2, and book-to-bill looks pretty good going into Q3 and Q4.
Also, you talked about book-to-bill in America. Similarly, looks quite good going into Q3 and Q4.
David Brockton
Can you just as a follow-up on that Mexico, was the provision movement related to that Mexican range, i.e., the pickup in Mexico is helped from a provision release for gross margins in the Americas?
Kate Ringrose
No, not really. Basically, just when we talk about provisions and inventory, basically our inventory provision is worked on historic sell-through, that's how we calculate it.
When that sell-through gets updated, that's what changes the provisioning dynamic.
Simon Pryce
No material impact.
David Brockton
Perfect. Thank you.
Operator
Thank you very much, David. Our next question comes from Jane Sparrow at JPMorgan.
Jane, your line is now open.
Jane Sparrow
Morning. Two questions, please.
Just firstly, how do you measure whether things like the AOV increase and some of the other metrics you've highlighted as improving, that they're due to the investments that you've been making in areas such as connected platforms and AI versus it just being a feature of kind of this stage of the cycle? Can you sort of track those specific marketing campaigns and see that they're outperforming what your usual marketing campaigns are, etc.?
Just a bit of color there, please. Then the second one, just to follow up on the question on inventory provisions, perhaps more generally, can you just quantify the impact of inventory provisions on gross margin year-on-year in the first half?
Then I think last year in the second half, you had a bit of benefit from inventory provisions, can you just again remind me of what the year-on-year impact of that will be in the second half on gross margin, just specifically on inventory provisions? Thank you.
Simon Pryce
Thanks, Jane. I'll take the first question, and then Kate will pick up the inventory provisioning question.
I think we look at all sorts of performance measures, both on a macro and a micro level, to determine whether the strategic investments in our customer data and enablement are working or not. We did talk, as Kate talked about, we talked on the fact that our average order value has gone from sort of £250 to north of £290.
A chunk of that is due to some larger orders in America, but also broader-range increased share across very specific customers. We also look at growth by customer type and now against the potential we believe that they can deliver to us.
We are now measuring our sales people on their ability to sell to potential rather than just absolute sales. We also look at people's digital journey.
We look at basket-to-order conversion, we look at order-to-checkout conversion. That's how we're looking at the impact of both of the larger investments that we made.
Then also, like these 12 campaigns I talked about, we actually look at individual campaigns and the returns they generate. We're measuring all of this stuff relatively granularly, and as you might expect, the lawyers wouldn't allow us to say some of these things unless there was evidence that they were backed by facts.
Margins?
Kate Ringrose
Margin. Just to clarify, your question was specifically on inventory provisions, is that right, or was it a broader margins question?
Jane Sparrow
Feel free to answer the second bit as well, but yeah, specifically gross margin impact year-on-year of inventory provisions in the first half, and then what we should expect for the second half.
Kate Ringrose
Last year, we were probably a couple of million heavier in inventory provisions in H1 '26, and that unwound in H2 '26. When I look at gross margins last year, I think the full year is the best representative of what we achieved, irrelevant of provisions, as the two balance each other out.
We've got a pretty clean view of that when I look at H1 '27, which is why when I guide to gross margins, I look at that as a flat position. If you're looking at with regards to operating margins, there's probably a few tens of basis points benefit of that in H2 last year to the detriment of H1 last year, which again flattened out by the time we got to the end of the year.
Jane Sparrow
Very clear. Thank you.
Simon Pryce
Yeah.
Operator
Thank you very much, Jane. Our next question comes from Rory McKenzie at UBS.
Rory, your line is now open.
Rory McKenzie
Thank you. Morning, all.
It's Rory here. Two questions, please.
Firstly, on growth, I don't want to seem churlish at all, as 7% is a good number, but all three of what you previously called your growth accelerators—so digital, Services and Solutions, and RS PRO—all grew a bit below the group average. Is that just a function of regional mix, or what else does that tell us about where the growth is coming from?
Maybe especially, there's obviously been a lot of debate this year around how LLMs are changing customer acquisition channels, the potential adoption of agentic procurement tools. Maybe especially, is there anything you're tracking or aware of that's affecting the digital growth at all?
Then the second area of my question was on margins. Appreciate you've given a lot of detail about where and why costs are growing, but that does limit operating leverage for now.
I think your incremental conversion margins were about 31% in H1 compared to perhaps the 45% to 50% that we've seen in other good cycles. How long do you think it can take before your group gets back to a position where you can drive that ongoing margin expansion?
Thank you.
Simon Pryce
Thanks, Rory. On the growth drivers and what's going on there, you're right that the growth accelerators are marginally behind the group rate of growth at a global level.
If you break it down into the regions, for example, RS PRO, strong growth in Americas and Asia Pacific, slower growth in Europe. That is more driven by the underlying broad-based demand and our getting our RS PRO product range positioned in the right place.
I'm not worried about the short-term slightly slower growth in RS PRO. There's still lots of potential for further RS PRO growth, particularly in America and in Asia Pacific, but also across Europe.
On digital, a chunk of that is due to the recovery that we're seeing in a digital search engine in North America. Mainly because we have introduced some increased minimum order charges and some increased freight costs, which has resulted in, and as expected, a reduction in some of our more transactional customer across the web.
At a macro level, we're spending a lot of time making sure that we're increasingly and very relevant to all customers searching across all channels. We have built, we are building and continue to invest in capabilities around our product data and how we present ourselves to make us more findable and discoverable for people searching through large language models and all that sort of stuff.
Then on our Services and Solutions, a lot of that is the ongoing repositioning of RSIS. Net-net, we are marginally behind on those growth drivers in the first half, but I don't think that's got anything to do with a structural decline of how important they are, and we continue to invest behind them, and I would expect their growth to pick up going into the second half and beyond.
Kate Ringrose
Margins, Kate? Operating.
Rory, our mid-term margins is predicated on getting operating leverage into what we believe the organization is capable of. I didn't quite follow all the numbers that you quoted, but if you're going back to 2022/2023, just something to remember as well, in that period of extraordinary demand post-COVID relief, there was very high gross margins as well in that, so that was part of what was driving that drop-through.
We're not signaling gross margins getting to that degree again. We do monitor drop-through very, very closely.
A key enabler to us really accelerating our operating leverage capability is the replatforming of the ERP, digital, commerce front-end, and the warehouse management systems. That work is underway.
It really accelerates over the next three-year period, and we will be launching it market by market, with the very big markets to the back end of that period, ensuring that we make sure our customer experience is enhanced and protected. I expect a real kind of step-change in the dynamic to be post that rollout.
Simon Pryce
Rory, I think we're very clear, tried to be very clear in our Capital Markets Day back in September 2024 of how the operating margin would develop in the group. I don't think we've materially changed that.
We're entering a phase now of expenditure around our process and operational excellence that Kate referred to, which is this next wave of improvement and efficiency enhancement, but you won't see the benefits of that come through for two or three years, as Kate has described. The operating leverage in the business, ex multi-year, but one-off investments we're making, I'm very comfortable is proving itself.
Rory McKenzie
Great. Thank you both.
That's all very helpful.
Operator
Thank you, Rory. Our next question comes from William Blunt at Rothschild & Co.
William, your line is now open.
William Blunt
Thank you. Good morning, both, and thanks for taking my questions.
The first is just on the high-potential accounts that you were talking about earlier. I think the statement says they were growing at 11%, quite a lot ahead of the group.
Could you just give us some more information on exactly how you're defining that group, and roughly what proportion of sales they represent? Then secondly, I think the statement calls out data centers as a growth driver, I think for the first time.
Could you maybe give us an update on your exposure there, and is this mainly project-related demand, or are you also building out a recurring maintenance business for that market as well? Thanks.
Simon Pryce
Did you just repeat the second question, William? Was that about data centers?
William Blunt
It was, yeah. It was that.
Simon Pryce
Got it. Thanks.
Look, on high-potential customers, we used to classify customers by the amount of spend they've incurred historically over the prior 12 months. We now define customers by the potential we believe we have to sell into them.
The way we've done that is through connecting our customer data platforms and standardizing our customer data across the globe. We are able to look at, on a micro-segmented basis, customers by all sorts of different dimensions.
We then compare the most we sell to those micro-segmented customers with the amount we actually sell, and that gives us our potential. It's not fantastically scientific, but it's a lot better way of assessing potential than looking at historical sales data.
In terms of our high-potential customers, the potential in them is significant and a large part of our future growth. In terms of the high-potential customers today, off the top of my head, I don't know, but I'm guessing it's around 25% of revenue, but I've got Carla next to me who's now scrabbling around to try and find the data.
If we can get it before the end of the call, we'll tell you whether the CEO's estimate is right or wrong, otherwise we'll let you know afterwards. Then on data centers, you're right, we don't generally across the globe supply into new build, and therefore, the level of accelerated investment going on today into data centers, we don't supply into directly because we are primarily an MRO supplier.
However, we also do quite a lot of project work for people who are undertaking small project builds in the electronics space. A lot of these people are panel builders, and the reason we are a good supplier of support to them is they often order in the same way that MRO demand is, which is relatively short lead time, high availability, high service.
Actually, quite a lot of those panel builders are supplying into the accelerated growth of data centers and the power generation and connection that goes around it. We are seeing some of our growth into those panel builders being as a result of the demand in data centers and the capital investment in those data centers.
It's probably, I know, 6% or 7% of group total today, something like that, and that would have been up from 3% or 4% of group total last year. Important tailwind, but doesn't move the needle massively, but an area of continuing to focus on.
Of course, once these things are built, they need MRO, and we see quite a lot of that in those country markets where we have an established data center infrastructure that needs support like Ireland. Somebody's just flagged, yeah, that the high-potential stuff is about 25% of our business today, but it's probably three-quarters of our potential.
William Blunt
That's extremely helpful. Thank you very much.
Simon Pryce
Thanks, William.
Operator
Thank you, William. Our final question today comes from Emanuele Sartori at Kepler.
Emanuele, your line is now open.
Emanuele Sartori
Hi. Good morning, all.
Thank you for squeezing me in. Just a couple, please.
Just one question on the volume. Obviously, you mentioned EMEA up 3% and APAC up 12%.
Just getting my numbers right if I missed it, sorry. Could you just break it down for Americas as well?
More importantly, how did volumes develop through, let's say, Q1 and Q2, and maybe if you could elaborate a bit on into October and exit into H2? Then my second question is on BPX profitability, with the revenue contribution around £33 million and £0.4 million of operating profit.
Is that representative of the underlying profitability, or are there some temporary integration costs, investment, or seasonality affecting the contribution? Thank you.
Simon Pryce
Thanks, Emanuele. Kate, volume/price split in America?
Kate Ringrose
Volume/price. I'm not seeing a significant difference between Q1 and Q2 in terms of what's going on in volume and price.
With regards to I think the group position that we gave, the split was 3% price, 4% volume. If I split that by region, APAC is much higher volume at the lower price, and EMEA is fairly even, 2% and a bit price and 2% and a bit more volume is our EMEA split, and Americas is pretty evenly split as well between price and volume.
Not much more to say on that. I would say broadly, price is slightly higher in Americas than it is in both EMEA and APAC.
Simon Pryce
The joys of tariffs. Emanuele, I think, I don't want to repeat what I said on exit rates.
I think we did say building momentum, clearly getting a bit better Q1, Q2, and encouraging start to Q3, but the comparators do get a bit more challenging in the second half. Probably all we're going to say on exit rates.
Then on BPX, BPX is a lower-margin model, always was. I think we do see some opportunity to improve their operating margins through integration over time, but I wouldn't expect that to change materially, and I don't think there were massive integration costs in the first half.
It is just the technical automation and control side of the lower, and we need to work with them over time to get them to a level where we think they are more naturally suited. We saw the same in Risoul, which is a not dissimilar business.
Nothing to worry about there, and it's quite a good opportunity, and I'm excited about BPX acquisition, actually. Pleased to see with how that business is developing within the RS Group, and I see lots of potential for it.
Emanuele Sartori
Perfect. Thank you.
Operator
Thank you, Emanuele. Are we done?
Simon Pryce
One more question, Molly?
Operator
Absolutely. Our last question comes from Lacie Midgley at Bloomberg.
Lacie, your line is now open.
Lacie Midgley
Oh, thank you very much. Morning, guys.
Thank you for the time today and the detail. I did have one on data centers, but you answered that very helpfully previously.
I guess just thinking about the supplier data you gave, that gives fairly broad evidence of the share gains that you've had across sort of most major categories. Can you quantify the magnitude of those gains, maybe across that £670 million revenue sample, give us maybe a sense of how much of the first-half like-for-like growth was kind of market recovery and versus RS-specific kind of share capture?
That would be helpful as one to finish on, if that's all right.
Simon Pryce
That most difficult question to finish on. Thanks a lot for that, Laci.
I think everybody knows defining our market's quite complicated because you need to really get into segmenting product categories by use case, by end-user market, by vertical, all that sort of stuff. I think if we to stand back, the way we look at it internally, at a group level, of our 7% underlying revenue growth reported in the first half, probably 1% is catch-up from the operational adjustments that we made last year that impacted our top line.
You're then left with 6%, and that 6% broadly divides about 3%, they're all thereabouts, on pricing, and 3%, they're all thereabouts, on volume. On the volume side of things, it sort of feels like about half of that is market and half is share gain.
It's very difficult to be more precise than that without getting into all sorts of detail about customer potential, category potential, and all that sort of stuff. Hopefully that gives you a bit of a feel for what we're seeing internally around share gain versus market split.
Lacie Midgley
That's very helpful. Appreciate it's a little bit of a tricky one.
Thanks very much, guys.
Simon Pryce
All right, go ahead.
Operator
Thank you, Lacie. I will now hand back to Simon Pryce for any closing remarks.
Simon Pryce
Thanks, Molly. Thanks, everybody, for listening, and we look forward to seeing you out and about.
With that, we'll close today's presentation. Thank you.
Operator
Thank you for joining the call. This concludes today's call.
You may now disconnect your lines.