Russel Metals Inc.
Q3 FY2026 · Earnings Call TranscriptNovember 5, 2026
Operator
Good morning, ladies and gentlemen, and welcome to the 2026 third quarter results for Russel Metals. Today's call will be hosted by Mr.
Martin Juravsky, Executive Vice President and Chief Financial Officer, and Mr. John Reid, President and Chief Executive Officer of Russel Metals.
Today's presentation will be followed by a question-and-answer period. At that time, if you have a question, please press star on your telephone keypad.
I will turn the call over to Mr. Martin Juravsky.
Please go ahead, sir.
Martin Juravsky
Great. Thank you, operator.
Good morning, everyone. I plan on providing an overview of the Q3 2026 results, and if you want to follow along, I'll be using the slides that are on our website.
Just go to the Investor Relations section and it's located in the Conference Calls submenu, or you can click on the link that is in the investor conference call paragraph of our recent press release. If you go to page 3, you can read our cautionary statement on forward-looking information.
I'm going to start the call by repeating what I said during our Q2 results call, and that is: this year is providing a great illustration of how the portfolio changes over the last few years has resulted in a meaningful reconfigured business with much better earnings generation profile. In 2024 through 2026, we deployed almost $700 million for acquisitions and capex and sold around $90 million of non-core assets.
These changes were aimed at growing the business, enhancing our return on capital, and improving our earnings profile through the cycle. The previous Q2 results, and now the Q3 results, illustrated that earnings power.
If we look specifically at Q3, the market conditions were strong, but were also very broad-based across our business segments and our geographic regions. To use a bit of a cliché, we were firing on all cylinders.
We had record quarterly revenues and earnings per share. The favorable market conditions began towards the end of Q1 and continued through to the end of Q3, and even in the early stages of Q4 so far.
The strong Q3 results were experienced despite the seasonal pull-back in volumes in July and August that occurs in both Canada and the US because of holidays. If we look at our metals service center segment tonnage in Q3 2026 versus Q3 2025, we were up 29% overall, or 7% on a same-store basis.
This reflects both the impact of the most recent acquisition of the Klöckner operations, but also our ability to gain market share. If you go to page 5, you get a snapshot of the quarter.
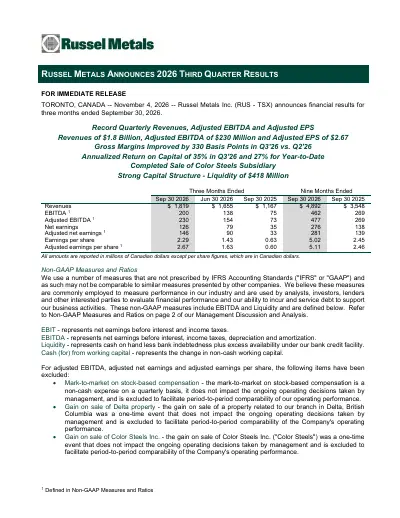
In Q3, we set a record for consolidated revenues, EBITDA, earnings per share, on both an adjusted and an unadjusted basis. To drill down a bit, there are three key points that I want to make: one, the strength in most of the markets we serve; two, progress on the Klöckner integration; and three, a pick-up in the relative performance of our Canadian service center operations.
On the first point, related to market conditions, we saw a 330 basis point improvement in our overall gross margins for Q3 versus Q2, with sizable gains both in our metals service center and steel distributor segments. On the second point, the former Klöckner branches generated another $33 million Canadian of EBITDA in Q3, which brings the year-to-date total to $57 million Canadian.
This amount compares to our purchase price of $128 million Canadian, and is so far provided an annualized return on capital of 42%. Hindsight's 20/20, but that transaction could not have been timed any better and it's worked out exceptionally well so far.
When we look at the gross margin migration of the former Klöckner branches during 2026, we have now captured a significant amount of the previous underperformance. In addition, the other key piece for the Klöckner integration is that on October 1st, we migrated off the transitional services agreement with Klöckner, and we are now running those branches on Russel's back office systems.
That's a really big milestone for us. On the third point, our Canadian service center business, just like the broader Canadian economy, has been lagging the performance of the US economy for a couple of years.
However, we started to see a noticeable improvement in the relative performance of our Canadian service centers over the past several months, as the economic conditions across Canada have improved and the outlook remains favorable. The last item on that top box is that we closed the sale of our Color Steels subsidiary.
That business generated about $70 million of revenues in 2025, had a book value of around $35 million, and we sold it for $42 million to recognize a $7 million pre-tax gain on sale. The sale is another example of selectively refining our portfolio to optimize return on capital.
In the case of Color Steels, it was a standalone niche business for us in Ontario that had focus on residential construction, which is not a priority for Russel. If we go further down that page into the middle row of the diagram, our Q3 capex was $26 million, which was a pick-up from Q1 and Q2, as some of our recently approved discretionary projects are starting to unfold.
I also expect that this average quarterly capex to remain similar into 2027 as more of these projects are being advanced. Capital deployed is over $2 billion for the first time.
Our capital grew from $1.3 billion at the end of 2023 to $1.8 billion at the end of 2025, and as I said, it's now over $2 billion. More importantly, we generate strong return on invested capital with that higher capital.
Our annualized ROIC was 35% in the quarter, and is now 27% year-to-date in 2026. Once again, our returns are industry-leading when compared to our publicly traded comparables.
We continue to grow our US business. Our US platform represented 57% of revenues in the quarter, which was up from Q1 and Q2 2026, and up significantly compared to 2025.
In the last row, returning capital to shareholders with our flexible approach, in Q3 we returned $24 million by dividends, but did not undertake share buybacks. That being said, since our NCIB was put in place back in 2022, we acquired a total of 8.7 million shares at $38.13 per share for 300 $333 million.
That worked out pretty well for us. In the bottom right box of the page, maintaining a strong capital structure is critical as we operate in a cyclical industry.
As a result, our liquidity is strong and we have flexible bank covenants, no financial covenants on our term debt, and our maturities are 2030 for both the bank debt and our term debt. Go to market conditions on page 6.
I'm going to sound like a broken record, but market conditions remain really strong and are broad-based. This rally seems to be driven by strong fundamentals of both demand and supply side for the products and markets where we operate.
We saw carbon sheet and plate prices have had steady increases over the past 12 months or so. Hot-rolled coil and plate prices in the US were up in Q3 versus Q2 and are currently prevailing slightly higher than the Q3 averages.
Overall demand is good, and supply chain inventories are limited, as shown on the two right-hand charts, and steel mill operating rates are tracking near 80%, with extended lead times for many products. This suggests continued optimism through the latter part of 2026 and into 2027.
One observation in Q4 though is that we will see some seasonal declines in volume due to fewer operating days around Canadian Thanksgiving, US Thanksgiving, and the December holidays, which will lead to lower overall tonnage in Q4 versus Q3. The bottom chart shows the prices for specialty metals, and you can see after a pull-back in aluminum prices a few months ago, it's stabilized at price levels that are favorable as compared to historical averages.
If we go to page 7, you see a summary of our trend EBITDA, and we've talked a lot in the past about changing our EBITDA profile to raise the cycle floor, raise the cycle ceiling, and as a result raise the cycle average. In addition, we focused on reducing the volatility through the cycle, and this chart presents those elements, and it showed the unadjusted EBITDA on a trailing 12-month basis.
Key takeaways: 2023 to 2026 EBITDA profile, which is the right-hand chart, looks an awful lot better than the profile in 2027 2017 to 2019 period in the left chart, as our initiatives has translated into tangible results. Our average EBITDA is higher, and the peaks to troughs are less volatile.
Also on the right chart, our trailing 12-month trends continue to improve. Lastly, our LTM unadjusted EBITDA as of September 30th was $530 million, and the improvement in those LTM trend results should continue into Q4 as I believe that Q4 2026 will be better than Q4 2025.
On page 8, we have a view of our working capital trends on the bottom chart, in comparison to unadjusted EBITDA trends on the top chart. The top chart, as I said earlier, our unadjusted EBITDA and our adjusted EBITDA hit record levels in Q3.
Unadjusted EBITDA was $200 million; the adjusted EBITDA was $230 million. On the bottom chart in Q3, we did use cash for working capital purposes due to the pick-up in business activity.
That being said, a large portion of the use of working capital was temporary in nature as we've decided to prepay a significant amount of accounts payable in September to simplify the Klöckner systems conversion that I mentioned earlier. On page 9, we have a snapshot of historical results.
Revenues were a quarterly record at over $1.8 billion. EBITDA was up due to favorable conditions that I previously mentioned.
Adjusted EBITDA in the far right chart on the top excludes the mark-to-market on stock-based compensation, also excludes the Q1 gain on the Delta sale, and also excludes the Q3 gain on the Color Steels sale. The adjusted EBITDA of $230 million for Q3 is a big lift from the $154 in Q2, and as I said earlier, was a quarterly record.
EPS, if we go to the bottom part of the page, in Q3 was $2.29 per share, which was a record and much higher than Q2. The middle table shows the adjusted EPS at $200 $2.67 per share, which was also a quarterly record and more than a $1 per share pick-up versus Q2.
Bottom right chart shows our return on invested capital. This uses the unadjusted results, our return on invested capital for 2026 was strong, above our cycle target and industry-leading again.
On page 10, we have the reconciliation of unadjusted to adjusted results. This is to put the quarter-over-quarter comparisons on an equivalent basis and make it easier to see the operational trends.
The only adjustments are two items: the mark-to-market on stock-based comp, which in Q3 was $37 million due to the $30 per share increase in the share price between June 30th and September 30th; the second item being the exclusion of the $7 million pre-tax gain on the Color Steels sale, as that was a non-recurring item. On this page, the gray row shows the comparable results and illustrates, as I said earlier, the large step-up from an adjusted EBITDA, adjusted net earnings, and adjusted EPS perspective, just set all-time quarterly records.
Going into more detail on page 11, from an income statement perspective, some of these items are already covered off, but I'll highlight a few items in particular. Record revenues of over $1.8 billion, it was up 10% from Q2 and up 56% from Q3 of 2025.
Now I'll talk more about volumes later, but it was another very good shipping quarter. Gross margin percent was up 330 basis points versus Q2, which was a much larger step-up than that experienced by our other publicly traded comparables, and I think that was primarily due to the significant improvement in our Canadian service center business and the former Klöckner branches, and I mentioned that earlier.
The contributions from the former Klöckner branches picked up again in Q3 on the back of the pick-up in Q2, and if we look at the cumulative EBITDA contribution from the first 9 months, it has totaled $57 million Canadian. Mark-to-market on stock-based comp was $37 million expense in Q3 versus a $15 million expense in Q2, and as I said earlier, we pull those out of the adjusted results for purposes of easier comparison.
In addition, we remove the $7 million gain on the Color sale from the adjusted results to also allow for comparative purposes. From a cash flow perspective, middle of the page, in Q3 we used about $200 million for working capital due to the surge in business activity.
As said earlier, a noticeable balance was temporary due to the prepayment of accounts payable to facilitate the Klöckner systems conversion. We realized $42 million on the sale of Color Steels.
Cumulative share buybacks since August 2022 are 14% of our then-shares outstanding for $333 million at an average cost of a little over $38 per share. Our quarterly dividend was 44 cents per share in September for a total of $24 million, and we have just declared the same quarterly dividend of 44 cents per share that will be paid in December.
Capex of $26 was a pick-up from Q2 as we were implementing the discretionary projects that I mentioned earlier. Lastly, the bottom of the page, from a balance sheet perspective, we remain in a really strong position with only $214 million of net debt, which equates to less than a half a turn net debt to EBITDA.
FX rate was flat September 30th versus June 30th, no impact on our OCI account, and our book value continued to grow and is up $1.85 per share from June 30th and is up about 14% from this time last year. If we go to page 12, this is the reconciliation of adjusted EBITDA variance last quarter to this quarter.
If we look at the service centers, starting on the left part of the page, the volumes were down about 3% due to normal seasonal activity, and this translated into a $7 million impact. However, margins picked up by $171 per ton, which resulted in about an $85 million improvement contribution to our margins.
Costs were up $9 million due to higher incentive compensation that is tied to financial performance. Energy field stores were up $1 million, which is a continuation of their strong bottom-line results, and steel distributors were up $11 million as they benefited from the favorable market conditions.
In the other bucket, corporate expenses were up due to higher variable comp and professional fees, and there was also a small pick-up at our Thunder Bay Terminal operation. Page 13, segmented P&L information.
Service centers, I'll go through this more detail on next page, but goes without saying it was a big increase over Q2. Energy field stores revenues were up again.
Gross margin percentage was down due to product mix, but was still pretty good. Operating profit in Q3 2026 was actually the highest quarterly level in the past 3 years.
Distributor revenues, gross margin, and EBIT were all up sharply in Q3 versus Q2 as they benefited from the strength in the market. Go to page 14, deeper dive on the metrics for the service center business.
Top right graph is tons shipped. Q3 was a near record despite the seasonal factors that impact Q3, and these shipments were up 7% over Q3 2025 as measured on a same-store basis, and up 29% overall, which reflects the gaining market share and strong demand.
Price realizations per ton were up 13% versus Q2, which really translated into a nice margin pick-up that is shown on the bottom right graph, and our gross margins per ton of $700 was a $171 per ton pick-up versus Q2, and was one of the best results that we have ever experienced. Page 15, inventory turns.
Overall, our inventory turns were steady at around 4.2 in Q3, with inventories tight as business activity is strong. Page 16, we have our inventory dollars.
Total inventory was up about $113 million since June, which is driven by higher costs per ton for the service centers and steel distributor segments, while tonnage was relatively flat. Page 17, capital structure update.
Liquidity is strong, which gives a lot of flexibility. We are investment-grade rated by both S&P and DBRS, and since last quarter end, our net debt increased by $69 million.
Our liquidity is $418 million, which gives us plenty of dry powder when we find capital deployment opportunities that meet our criteria. Page 18, we have a summary of our capital allocation priorities.
Left part of the page, we show our investment approach. We seek average returns over the cycle greater than 15%, and as already discussed, we've consistently delivered above that target.
Year-to-date 2026 is 27% annualized. Facility modernization front, we have three projects on the go that are each around $10 million, and additional projects are expected once those feasibility assessments are completed.
In addition, there is a series of value-added equipment projects also underway. On the acquisition front, we have been active over the past few years and we continue to look at opportunities that could complement our existing business.
That said, we are currently focused on potential tuck-in opportunities that could fit with our US service center operations over the near term. On the right part of the page, we show our approach to returning capital to shareholders.
Here, we have a flexible approach, and I have more details on the next page. Page 19, deeper dive on returning capital to shareholders.
Top left graph, we have our longer-term dividend profile, and after the June dividend increased to 44 cents per share per quarter, we have now completed four dividend increases over the past 4 years, which in total represented a 16% cumulative increase since the early 2023 dividend level. Bottom left shows our quarterly NCIB activity since we put it in place in August 2022.
We view it as an opportunistic way to buy back shares, and as we said earlier, the cumulative NCIB since 2022 was a 14% reduction in our share count at an average cost of $38.13 per share for a total of $333 million, so that opportunistic approach I think has worked out extremely well. On the top right chart, the aggregation of dividends versus NCIB over the past few years shows the cumulative impacts, and it's worth noting on the chart that even though our dividend per share has increased by a meaningful amount, our total dividend outlay has remained at around that $24 million per quarter because of the reduction in our share count, which is shown on the bottom right-hand chart.
In closing, and on behalf of John and other members of the management team, I'd like to express our thanks to everyone on the Russel team for their contributions. It is very nice to see how the hard work over the past few years is translating into such strong results.
Operator, that concludes my introductory comments. You can now please open the line for questions.
Operator
Thank you. Ladies and gentlemen, we will now begin the question-and-answer session.
Should you have a question, please press the star followed by the number one on your touch-tone phone, and you will hear a prompt that your hand has been raised. Should you wish to decline from the polling process, please press the star followed by the number two.
Your first question comes from the line of James McGarragle of RBC Capital Markets. Your line is now open.
James McGarragle
Hey, good morning and congrats on the strong results.
Martin Juravsky
Thanks, James.
James McGarragle
I just had a question, with competitors like Reliance, they're obviously dedicating a lot of capacity to the border wall projects, data center infrastructure, and I'm sure you're seeing the indirect benefits through tighter industry capacity and better pricing. I guess what I'm asking is, is the demand you're seeing and the pricing strength, is that from a few specific service centers or that are benefiting from projects or in a few specific sectors?
Or are you seeing demand strength more broad-based across all of your end markets?
John Reid
Thanks, James. It is broad-based.
36 years in the industry, I don't recall ever seeing this broad-based a demand. We are participating in data centers as you mentioned.
We do actually do some participation with the border wall project as well. We're seeing it across everything from infrastructure, government spending on both sides of the border.
Manufacturing is doing really well if you look at the Purchasing Managers' Index, which is a good indicator for manufacturing. It's stayed above 50, which means it's expanding for a long period of time now.
It is really broad-based that we're seeing. The steel mills, in particular, when you look at their lead times are extended well into 2027 and some will have rolling schedules, but they're already closed out, they're allocating tons.
We're just seeing an extreme broad-based demand across all industries that we serve right now. It's a very exciting time for us.
Then
James McGarragle
I just also wanted to ask on some of the market share gains that you've had. You obviously, you've outperformed the industry in terms of volumes.
Can you just talk about what's driving that? Is that your procurement advantages, your strong service offering potentially?
Just want to get your view on if you think this is sustainable, or do you think there's any risk that you give some of this back when and if the market actually starts to slow down?
John Reid
Yes, I think part of this is from our value-added initiative that we're seeing, we continue to gain share in that. You chip away at it every quarter, and you continue to grow and continue to build on it.
It's a very sticky piece to our business. It's not something that it's transactional, maybe as three bids in a buy-type scenarios.
We continue to grow on that platform. We've expanded in our non-ferrous area, so that's a new growth product for us that we continue to expand in.
Then obviously with the acquisitions, with both Samuel and Klöckner that we've acquired, we've started to initiate the value-add there, and we'll continue to do so to grow further market share gains.
James McGarragle
Okay. Appreciate it, and I'll turn the line over.
Thank you.
Martin Juravsky
Thanks, James.
Operator
Your next question comes from the line of Frederic Bastien of Raymond James. Please go ahead.
Frederic Bastien
Hi, guys. I'm lost for words to describe your results, congrats on that.
Until recently, the market seemed to be operating under the assumption that elevated steel tariffs were here to stay. Now, following the Democratic sweep, is that still a reasonable assumption?
Has anything changed in your thinking about where steel prices could be headed next year?
John Reid
It's a good question, Fred. I don't know that I have a concrete answer there.
We'll see where this resolves to. I think that the tariff situation is probably here to stay.
If you look at North America as a whole, on a world capacity level compared to what we're using in North America, I would assume if there's an agreement that's in the works, which we've heard it was imminent for a year now, I'll be hesitant to say that it's imminent. If we have that agreement, I would think they would work very collectively together to provide a very level playing field for North America as a whole, being both Canada and the US.
I think that will stay in place in some capacity. How it works out between the two countries, I really don't know.
I just know that we'll be on a level playing field in North America with all of our competitors.
Frederic Bastien
Okay. Thanks for that.
Now my model extends a number of years and I don't know if I've seen the metal service center margins coming that high. Where do you think these margins could settle in the fourth quarter?
Martin Juravsky
Yeah. Fred, let me put it to you this way.
The thing that we're seeing in the early part of Q4 is not all that different from what we saw at the tail end of Q3. Pricing levels, margins are holding in at a pretty strong level.
What extends beyond October into November and December still to be written. At some point, I assume steel prices will plateau, and then that might yield a little bit of margin compression at that point.
We're still seeing pretty strong results in the early part of Q4 on the margin front.
John Reid
Just to add on that, Fred, we've seen increases from the steel mills as recently as this morning. It looks like it's continuing that slow trend upward.
Again, with the backlogs where they are at the steel mills, that there just doesn't seem to be a lot of pressure on the pricing. There's always market dynamics or a black swan event that could change that, but to Marty's point, I think you're just going to see a more of the same-type performance in Q4, notwithstanding the standard holiday season that we have out there.
Frederic Bastien
Okay. I'd expect you to take advantage of the current favorable conditions to replenish your war chest and position the business for the next M&A window.
Is that a fair assessment of your thinking?
Martin Juravsky
I would characterize it a little bit different, because we have had a very flexible balance sheet, which has allowed us to take advantage of market opportunities when they present themselves, and I use Klöckner acquisition as a good example. One of the things that allowed us to do that transaction was we did have a very strong capital structure, we could write a check in very easy order.
We could move quickly in very easy order. It really becomes a function of not so much the war chest and whether we have it, because we do have it.
It becomes a question of what are the right opportunities that we want to seize upon. If we go to the here and now, there are some interesting opportunities, not anywhere close to the finish line yet, but there are some interesting opportunities for tuck-ins that are on our radar screen.
Frederic Bastien
Thank you very much.
Martin Juravsky
Thanks, Fred.
Operator
Once again, if you wish to ask a question, please press star one to join the queue. Your next question comes from the line of Jonathan of Goldman Sachs.
Oh sorry, it's Jonathan Goldman of Scotiabank. Please go ahead.
Jonathan Goldman
Hey, good morning, guys. I've been called worse.
Thanks for taking my questions. Maybe just a housekeeping one to start.
Marty, you mentioned fewer days in Q4 just because of holidays, Thanksgiving, otherwise. I'm thinking about the comparable to Q3.
How many fewer days in the period would there be, just comparing like-to-like? It's
Martin Juravsky
mid-single digits, call it 5% to 7% impact with operating days. The one other wild card, though, is separate and apart from the operating days, you do, from time to time, have another dynamic that plays out and we don't always have visibility on that, which is at some point and in some years, people just have put their order books away in December, and when they are taking holidays.
Oftentimes there's a little bit of a lack of visibility of what December looks like, because even though there's statutory holidays in there, there's other situations where people tap on additional days to statutory days and what they might have ordered in a normal month, that may then slip into the next month. The end of December is a little bit hard to predict, but as a general rule, 5% to 7% impact on operating days is a good rule of thumb.
Jonathan Goldman
That's helpful. Then you guys talked about kind of Canada maybe accelerating, whether it was through the quarter, the metal service centers.
Maybe what are you seeing there? What are the end markets that are accelerating?
How much has it lagged the US? How should we think about kind of volume trajectory in that region?
John Reid
Jonathan, Canada had really joined the party in June, late May, early June, picking up. Again, as I mentioned earlier, we're seeing it on a broad-based number of fronts.
Data centers are very busy, the ones that are out there, infrastructure related to data center, infrastructure related to energy. Nation-building projects are starting to get traction now where we're seeing things.
Manufacturing is picking up. Ag had been at a very low point, we're starting to see traction there.
Really, every end market we're touching right now is all picking up in Canada. It had already been very busy in the US, so that it's narrowed that gap between the two, but our US continues to be as Marty decided earlier, about 57% of our business.
We're a little larger in the US, but again, both sides have come on very strong. Canada's numbers, again, were very, very strong for the quarter.
Jonathan Goldman
That's good to hear. John, maybe I can sneak in another one.
We did conversation about tariffs and whether they stay or not stay, but can you maybe talk about all these investments you've seen in the US recently, or at least announcements of capacity expansion in steel? Even in Canada, I think there's been some pretty poignant rhetoric about having kind of some sort of protection to make a level playing field in North America.
The interests in North America about protecting domestic steel, how deep do you think that impetus is right now?
John Reid
Again, you have a couple questions there. Again, the investment we're seeing, there is investment in steel mills going into the US right now.
Obviously, with the acquisition of US Steel, there was a commitment made by Nippon to the US government. They've spent several billion dollars on steel mills now.
We're seeing the government in Canada is stepping in, I think, with $5.5 billion to help the steel industry in Canada. Keep in mind, the US total capacity to date is roughly 110 million tons a year, but that's not even 10% of the world market.
Canada's much smaller. Again, if we do a large investment in the North American market, it's still not impacting the world market in a dramatic fashion.
It is helping offset capacity from where imports are coming in. We still need to import steel throughout North America to meet our demand, either by product we don't make in Canada or the US, or we're underserved.
There still is an import capacity, so that can be offset with domestic capacity. All these mills that are coming online could offset the import numbers that are coming in and that would play into the tariff that you mentioned.
Again, I think the two countries will be working closely together to make sure there's not a disruption to hurt our longer-term manufacturing base, our industrial base, obviously our steel industry base, all of which bode well for us.
Martin Juravsky
The only thing I'd add is when folks are making announcements on investing here and there on various projects, the lead time associated with those coming to fruition is not months or quarters, it's years. There's no doubt that there will be opportunities for reinvestment in the North American steel-producing side of things, but those don't happen quickly or overnight.
Jonathan Goldman
Okay. Just to clarify, you're talking about US and Canada working in tandem as a North American unit against the world, or are you talking about Canada versus US in terms of kind of working on a trade agreement in terms of steel protectionism?
John Reid
I would hope they can work as kind of a united front to keep the North American economy working as one, and then trade amongst each other in an effective way, but I don't have the answer to that question right now. As that seems to be a moving target.
We'll see where that settles out. Again, they're in talks right now that seem to be moving further than they have in the past, but I don't have any clarity as to what that's going to look like in the near future.
Jonathan Goldman
No, fair enough. Thanks for taking my question.
I'll get back in queue.
Martin Juravsky
Thanks, Jonathan.
Operator
There are no further question at this time. I will now turn the call back over to Martin Juravsky for the closing remarks.
Martin Juravsky
Great. Thank you, operator, and thank you, everyone, very much for joining our call.
If you have any questions, please feel free to reach out anytime. Thank you.
Operator
Ladies and gentlemen, that concludes today's call. Thank you for joining.
You may now disconnect.