Resonac Holdings Corporation
Q3 FY2026 · Earnings Call TranscriptNovember 11, 2026
Hideki Somemiya
Greetings. I'm Hideki Somemiya, CFO of Resonac Holdings Corporation.
I'd like to thank you deeply for your continued understanding and support for our company. Today, I'll review our consolidated financial results for the third quarter of our fiscal year ending December 31st, 2026.
Please turn to slide 2, Key Takeaways. I have four main points.
First, revenue and core operating profit in the Semiconductor and Electronic Materials segment were both very strong. In the July-September quarter, sales of products for advanced semiconductors, including AI applications, remained very strong, and both revenue and core operating profit surpassed their previous quarterly highs by a wide margin.
Second, consolidated core operating profit increased significantly year-on-year, driven by strong performance in semiconductor and electronic material and the return to profitability of the Chemicals segment from the effect of last year's structural reforms in the graphite electrode business. As a result, core operating profit for January-September grew 2.4 times year-on-year.
Third, we significantly raised our full-year 2026 core operating profit forecast again from the revision at the half-year results. In Semiconductor and Electronic Materials, we expect sales of products for advanced semiconductors, including AI, to grow faster than our previous forecast, and we have raised our core operating profit forecast by 28% to ¥250 billion.
We also expect the EBITDA margin to improve by 3 percentage points from our previous forecast to 27.4%. Fourth, our portfolio reform has entered its final phase.
We completed the partial spin-off of Crasas Chemical on October 1st. With the increased likelihood of strategic option for the graphite electrode business, we have reflected the related non-recurring items in our full-year 2026 forecast.
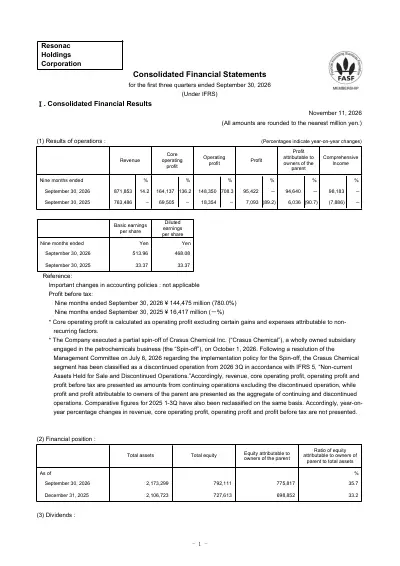
Let me now turn to our consolidated financial results for the first nine months of 2026. Slide 4 summarizes our consolidated results for January-September 2026 compared with the same period of last year.
I'll go into the details shortly. During January-September, revenue was ¥871.9 billion, and core operating profit was ¥164.1 billion, both up significantly year-on-year.
Our major financial indicators also improved. The EBITDA margin rose 8.4 percentage points year-on-year to 26.3%, and the adjusted net D/E ratio improved substantially to 0.54 times.
Slide 5 shows our consolidated results for January-September 2026 compared with the same period last year. Following the completion of the partial spin-off of the Crasas Chemical, we reclassified it as a discontinued operation and retrospectively restated the prior-year figures.
Revenue for the first nine months was ¥871.9 billion, up ¥108.4 billion year-on-year. Revenue growth in Semiconductor and Electronic Materials more than offset the negative revenue impact of the transfers of the automotive molded parts business as well as FIAM Energy Technology, which operates a lead-acid battery business.
Core operating profit rose ¥94.6 billion to ¥164.1 billion, or 2.4 times the prior-year level. Below that, non-recurring items were -¥15.8 billion for the first nine months, partly reflecting a one-off expense for the revision of our retirement benefit plan.
Operating profit under IFRS rose ¥130 billion year-on-year to ¥148.4 billion. We booked a loss related to the partial spin-off of Crasas Chemical in the July-September quarter.
As a result, profit from discontinued operations declined ¥11.7 billion year-on-year to a loss of ¥8.8 billion. Crasas Chemical was listed on September 29th, and the partial spin-off was completed on October 1st, marking an important milestone in our portfolio reform.
Profit attributable to owners of the parent rose ¥88.6 billion year-on-year to ¥94.6 billion. EBITDA was ¥229 billion, and the EBITDA margin improved 8.4 percentage points to 26.3%.
The adjusted net D/E ratio improved significantly from 0.83 times at the previous year-end to 0.54 times. This was due to the following: strong performance increased retained earnings and equity; reclassification associated with the partial spin-off of Crasas Chemical reduced the interest-bearing liabilities; and a partial conversion of our convertible bonds further reduced interest-bearing liabilities and increased equity.
As noted in the footnote, in calculating the adjusted net D/E ratio, we treat 50% of the subordinated loan as equity capital, based on the credit rating from Japan Credit Rating Agency. Slide 6 breaks down the ¥94.6 billion year-on-year increase in core operating profit for January-September from ¥69.5 billion to ¥164.1 billion.
Sales volume added ¥59.7 billion, driven mainly by strong performance in Semiconductor and Electronic Materials. Sales price added ¥25.1 billion, mainly reflecting price increase in Semiconductor and Electronic Materials and other segments in response to higher raw material and other costs.
Variable and fixed costs reduced profit by ¥34.6 billion, reflecting higher raw material costs and increases in fixed costs across the segments, primarily labor costs. Foreign exchange rates added ¥10.6 billion, mainly because the yen was about ¥10 weaker against the US dollar than in the same period last year.
Other factors added ¥33.8 billion, reflecting a better product mix in Semiconductor and Electronic Materials, Chemicals, and other segments, as well as higher earnings from revenue growth at overseas sales subsidiaries. Slide 7 shows quarterly performance by segment.
Semiconductor and Electronic Materials has performed very strongly since the first quarter. In July-September, steady sales volume growth in products for advanced semiconductors, including AI, and price revisions in response to higher raw material costs lifted both revenue and core operating profit well above their previous record highs.
EBITDA margin reached 44.3%. Consequently, consolidated revenue for the quarter was ¥325.1 billion, core operating profit was ¥79.2 billion, and the EBITDA margin was 31.2%.
Slide 8 shows year-on-year changes in revenue, core operating profit, and EBITDA margin by segment. Semiconductor and Electronic Materials led consolidated performance, with revenue up 37% and core operating profit more than doubling, increased by 114%.
Chemicals returned to profitability, supported by higher graphite electrode sales volumes and the realization of structural reform effects. Slides 9 through 11 summarize performance by segment.
On slide 9, Semiconductor and Electronic Materials revenue rose 37% year-on-year to ¥500.8 billion. Core operating profit rose 114%, or ¥84.6 billion, to ¥158.6 billion.
Back-end semiconductor materials drove revenue and profit growth, mainly through higher sales volumes for advanced semiconductors, including AI. Front-end semiconductor materials and device solutions also posted double-digit year-on-year revenue growth.
The segment's EBITDA margin also improved significantly, from 29.1% to 38.9%. Turning to page 10, Mobility revenue fell 8% year-on-year to ¥121.7 billion, while core operating profit rose ¥2.8 billion to ¥4.8 billion.
The transfer of the automotive molded parts business reduced revenue, while increased demand from certain customers helped lift profit. Innovation Enabling Materials performed solidly overall, with performance varying by product.
Revenue rose 11% year-on-year to ¥75.3 billion, and core operating profit increased ¥1.5 billion to ¥9.6 billion. Slide 11 covers Chemicals.
Revenue rose 13% year-on-year to ¥141.9 billion, and core operating profit improved by ¥8.9 billion to a profit of ¥1.5 billion. The graphite subsegment accounted for most of the revenue and profit growth.
A recovery in graphite electrode sales volumes lifted revenue, and the benefits of structural reforms helped the segment return to profitability. Slide 12 shows the main items below core operating profit compared with the same period last year.
Non-recurring items are on the left, and financial income and costs and equity in earnings are on the right. The net loss from non-recurring items on the left narrowed by ¥35.4 billion year-on-year to ¥15.8 billion.
This year's results included a one-off expense for the revision of our retirement benefit plan, while the prior-year results reflected the impact of business transfers, including that of FIAM Energy Technology. Net financial costs rose ¥2 billion year-on-year to ¥10.6 billion.
Higher foreign exchange losses were the main factor, despite an improvement in net interest income and expenses. Finally, equity in earnings was unchanged year-on-year at ¥6.7 billion.
Slide 13 shows our consolidated statement of financial position. Assets and liabilities classified as held for distribution to owners increased significantly from the previous year-end due to reclassification associated with the partial spin-off of Crasas Chemical.
Today, I'll focus on the other movements. On the asset side on the left, total assets increased ¥66.6 billion from the previous year-end to ¥2,173.3 billion.
This was due to strong performance in Semiconductor and Electronic Materials driving increases in trade receivables and cash and cash equivalents. Total liabilities were broadly flat at ¥1,381.2 billion, up ¥2.1 billion from the previous year-end.
Total equity rose ¥64.5 billion to ¥792.1 billion. As I mentioned earlier, strong performance in Semiconductor and Electronic Materials and other segments increased retained earnings.
Interest-bearing liabilities fell significantly from the previous year-end to ¥801.7 billion, partly due to the reclassification associated with the partial spin-off of Crasas Chemical and the partial conversion of our zero-coupon convertible bonds. As of the end of September 2026, about 40% of the ¥100 billion in convertible bonds issued had been converted.
Net interest-bearing liabilities after deducting cash and cash equivalents have dropped to ¥527.2 billion. Let me now turn to our forecast for the fiscal year ending December 31st, 2026.
Please turn to slide 15, 2026 Consolidated Forecast. We have raised the full-year core operating profit forecast that we released on August 6th, reflecting strong performance in Semiconductor and Electronic Materials.
We have also factored in losses related to strategic options for the graphite electrode business and lowered our forecast for operating profit under IFRS and below. As for the exchange rate, based on the actual rate of ¥158.6 per US dollar for January-September, we now assume ¥158.9 per dollar for the full year.
Our revised forecast is for revenue of ¥1,235 billion and core operating profit of ¥250 billion. Mainly reflecting strong performance in Semiconductor and Electronic Materials, we have raised our revenue forecast by ¥70 billion and our core operating profit forecast by ¥54 billion.
With the increased likelihood of implementing a strategic option for the graphite electrode business, we have factored in the related losses, and so we expect non-recurring items to be ¥99 billion worse than previous forecast, and profit attributable to owners of the parent is now forecast at ¥75 billion, down ¥37.5 billion from the previous forecast. As for the main financial indicators, we expect the EBITDA margin to reach 27.4%, an improvement of 3 percentage points from our previous forecast.
Implementing a strategic option for the graphite electrode business will be the 20th structural reform action in the portfolio reform I have promoted since becoming CFO of Resonac. The loss we have factored into non-recurring items represents our largest one-off charge to date.
I want to emphasize that implementing this action will bring the round of portfolio reform we began when Resonac was formed to a close. Slide 16 shows our revised revenue and core operating profit forecast by segment.
We significantly raised our forecast for Semiconductor and Electronic Materials, led by strong performance in AI-related materials. For the other segments, we have reflected recent demand trends, with no major changes from the previous forecast.
Slide 17 shows the trends in revenue, core operating profit, and EBITDA margin by segment after the revision. Please refer to it as needed.
Finally, slide 18 shows the financial indicators in our 2026 consolidated forecast. We expect basic earnings per share, a profitability indicator, to be ¥404, down ¥202 from our previous forecast.
This reflects the temporary decline in profit attributable to owners of the parent as we factor in losses related to strategic options for the graphite electrode business. We expect ROIC to reach 15%, well above the 10% target we set as part of our ambition to compete globally.
That concludes my review. Before I close, I'd like to add two points.
First, some online media outlets recently reported that we could lose our competitive advantage in materials for AI semiconductors. We absolutely do not believe that is the case.
We have established a strong position in high-end applications, particularly AI semiconductors, and we are confident that we can maintain it. Second, about the current market conditions and our stock price.
Current-term market conditions remain very challenging, and our share price has also declined. We believe our shares are significantly undervalued at current levels, and that price does not fully reflect our medium- to long-term growth potential or corporate value.
We will continue engaging with market participants so that our share price better reflects our fair value. We appreciate your continued support.
The appendix begins on page 19. Please refer to it as needed.
That concludes my presentation. Thank you very much for your attention.